TCR-based lineage tracing: no evidence for conversion of conventional into regulatory T cells in response to a natural self-antigen in pancreatic islets
- PMID: 17724131
- PMCID: PMC2118689
- DOI: 10.1084/jem.20070822
TCR-based lineage tracing: no evidence for conversion of conventional into regulatory T cells in response to a natural self-antigen in pancreatic islets
Abstract
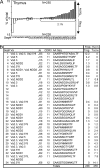
Foxp3-expressing regulatory T (T reg) cells derive primarily from selection in the thymus. Yet conversion of mature conventional CD4(+) T (T conv) cell lymphocytes can be achieved in several conditions, such as transforming growth factor beta treatment, homeostatic expansion, or chronic exposure to low-dose antigen. Such conversion might provide a means to generate peripheral tolerance by "converting" potentially damaging T cells that react to self-antigens. We tested this hypothesis in mice transgenic for the BDC2.5 T cell receptor (TCR), which is representative of a diabetogenic specificity that is naturally present in NOD mice and reactive against a pancreatic self-antigen. In the thymus, before any exposure to antigen, clonotype-positive T reg and T conv cells express a second TCRalpha chain derived from endogenous loci. High-throughput single-cell sequencing of secondary TCRs of the Valpha2 family showed their joining CDR3alpha regions to be very different in T reg and T conv cell thymocytes. These specific CDR3alpha motifs, thus, provided a "tag" with which to test the actual impact of T conv to T reg cell conversion in response to peripheral self-antigen; should the autoreactive clonotypic TCR induce T conv to T reg cell conversion upon encounter of cognate antigen in the pancreas or draining lymph node, one would expect to detect tag CDR3alpha motifs from T conv cells in the T reg cell populations. Sequencing large numbers of peripheral BDC(+)Valpha2(+) cells showed that little to no conversion occurs in response to this pancreatic autoantigen.
Figures


References
-
- Kim, J.M., and A. Rudensky. 2006. The role of the transcription factor Foxp3 in the development of regulatory T cells. Immunol. Rev. 212:86–98. - PubMed
-
- Sakaguchi, S., M. Ono, R. Setoguchi, H. Yagi, S. Hori, Z. Fehervari, J. Shimizu, T. Takahashi, and T. Nomura. 2006. Foxp3+ CD25+ CD4+ natural regulatory T cells in dominant self-tolerance and autoimmune disease. Immunol. Rev. 212:8–27. - PubMed
-
- Ziegler, S.F. 2006. FOXP3: of mice and men. Annu. Rev. Immunol. 24:209–226. - PubMed
-
- Apostolou, I., A. Sarukhan, L. Klein, and H. von Boehmer. 2002. Origin of regulatory T cells with known specificity for antigen. Nat. Immunol. 3:756–763. - PubMed
Publication types
MeSH terms
Substances
Grants and funding
LinkOut - more resources
Full Text Sources
Molecular Biology Databases
Research Materials

