

Phosducin regulates the expression of transducin betagamma subunits in rod photoreceptors and does not contribute to phototransduction adaptation
- PMID: 17724163
- PMCID: PMC2151643
- DOI: 10.1085/jgp.200709812
Phosducin regulates the expression of transducin betagamma subunits in rod photoreceptors and does not contribute to phototransduction adaptation
Abstract
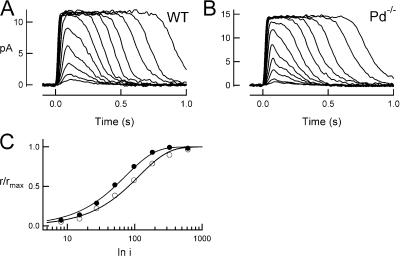
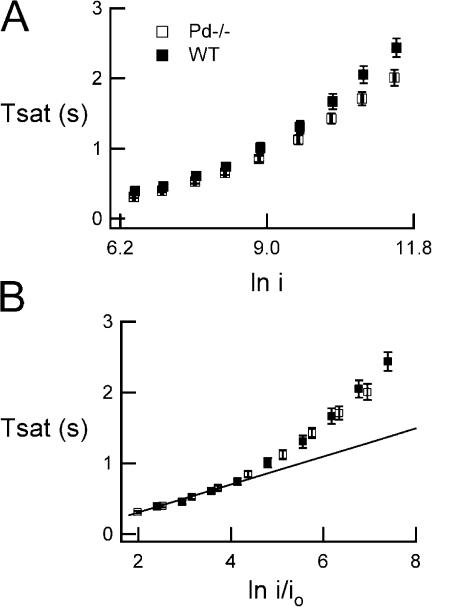
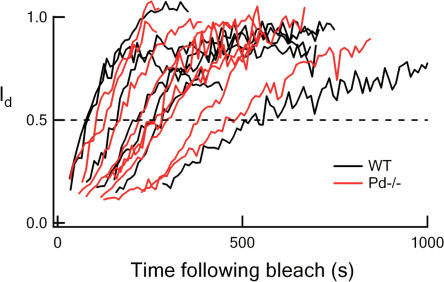
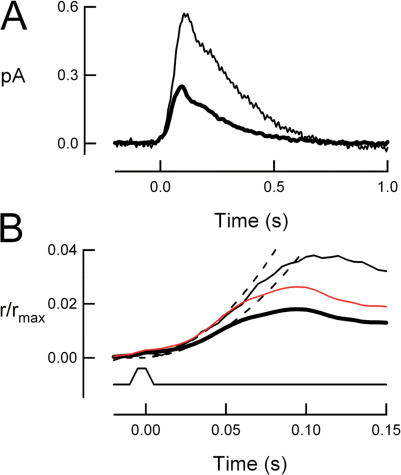
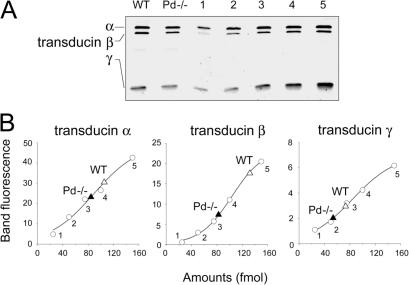
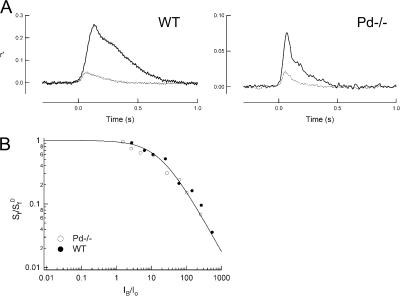
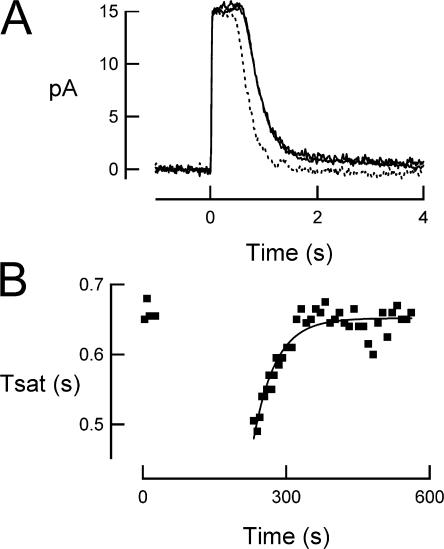
For over a decade, phosducin's interaction with the betagamma subunits of the G protein, transducin, has been thought to contribute to light adaptation by dynamically controlling the amount of transducin heterotrimer available for activation by photoexcited rhodopsin. In this study we directly tested this hypothesis by characterizing the dark- and light-adapted response properties of phosducin knockout (Pd- / -) rods. Pd- / - rods were notably less sensitive to light than wild-type (WT) rods. The gain of transduction, as measured by the amplification constant using the Lamb-Pugh model of activation, was 32% lower in Pd- / - rods than in WT rods. This reduced amplification correlated with a 36% reduction in the level of transducin betagamma-subunit expression, and thus available heterotrimer in Pd- / - rods. However, commonly studied forms of light adaptation were normal in the absence of phosducin. Thus, phosducin does not appear to contribute to adaptation mechanisms of the outer segment by dynamically controlling heterotrimer availability, but rather is necessary for maintaining normal transducin expression and therefore normal flash sensitivity in rods.
Figures
Similar articles
-
Phosphorylation of phosducin accelerates rod recovery from transducin translocation.Invest Ophthalmol Vis Sci. 2012 May 1;53(6):3084-91. doi: 10.1167/iovs.11-8798. Invest Ophthalmol Vis Sci. 2012. PMID: 22491418 Free PMC article.
-
Phosducin facilitates light-driven transducin translocation in rod photoreceptors. Evidence from the phosducin knockout mouse.J Biol Chem. 2004 Apr 30;279(18):19149-56. doi: 10.1074/jbc.M311058200. Epub 2004 Feb 18. J Biol Chem. 2004. PMID: 14973130
-
Transducin gamma-subunit sets expression levels of alpha- and beta-subunits and is crucial for rod viability.J Neurosci. 2008 Mar 26;28(13):3510-20. doi: 10.1523/JNEUROSCI.0338-08.2008. J Neurosci. 2008. PMID: 18367617 Free PMC article.
-
The physiological roles of phosducin: from retinal function to stress-dependent hypertension.Cell Mol Life Sci. 2011 Feb;68(4):599-612. doi: 10.1007/s00018-010-0550-0. Epub 2010 Oct 31. Cell Mol Life Sci. 2011. PMID: 21069424 Free PMC article. Review.
-
Tuning outer segment Ca2+ homeostasis to phototransduction in rods and cones.Adv Exp Med Biol. 2002;514:179-203. doi: 10.1007/978-1-4615-0121-3_11. Adv Exp Med Biol. 2002. PMID: 12596922 Review.
Cited by
-
Membrane guanylyl cyclase complexes shape the photoresponses of retinal rods and cones.Front Mol Neurosci. 2014 Jun 2;7:45. doi: 10.3389/fnmol.2014.00045. eCollection 2014. Front Mol Neurosci. 2014. PMID: 24917784 Free PMC article. Review.
-
Compartmentalization of Photoreceptor Sensory Cilia.Front Cell Dev Biol. 2021 Feb 4;9:636737. doi: 10.3389/fcell.2021.636737. eCollection 2021. Front Cell Dev Biol. 2021. PMID: 33614665 Free PMC article. Review.
-
Phosphorylation of phosducin accelerates rod recovery from transducin translocation.Invest Ophthalmol Vis Sci. 2012 May 1;53(6):3084-91. doi: 10.1167/iovs.11-8798. Invest Ophthalmol Vis Sci. 2012. PMID: 22491418 Free PMC article.
-
Overexpression of rhodopsin alters the structure and photoresponse of rod photoreceptors.Biophys J. 2009 Feb;96(3):939-50. doi: 10.1016/j.bpj.2008.10.016. Biophys J. 2009. PMID: 19186132 Free PMC article.
-
Embryonic markers of cone differentiation.Mol Vis. 2016 Dec 22;22:1455-1467. eCollection 2016. Mol Vis. 2016. PMID: 28031694 Free PMC article.
References
-
- Burns, M.E., and V.Y. Arshavsky. 2005. Beyond counting photons: trials and trends in vertebrate visual transduction. Neuron. 48:387–401. - PubMed
-
- Calvert, P.D., N.V. Krasnoperova, A.L. Lyubarsky, T. Isayama, M. Nicolo, B. Kosaras, G. Wong, K.S. Gannon, R.F. Margolskee, R.L. Sidman, et al. 2000. Phototransduction in transgenic mice after targeted deletion of the rod transducin α-subunit. Proc. Natl. Acad. Sci. USA. 97:13913–13918. - PMC - PubMed
-
- Calvert, P.D., V.I. Govardovskii, N. Krasnoperova, R.E. Anderson, J. Lem, and C.L. Makino. 2001. Membrane protein diffusion sets the speed of rod phototransduction. Nature. 411:90–94. - PubMed
