. 2007 Sep 4;104(36):14513-8.
doi: 10.1073/pnas.0705495104. Epub 2007 Aug 27.

Neuronal population coding of continuous and discrete quantity in the primate posterior parietal cortex

Affiliations

Neuronal population coding of continuous and discrete quantity in the primate posterior parietal cortex

Oana Tudusciuc et al. Proc Natl Acad Sci U S A. .

Abstract

Quantitative knowledge guides vital decisions in the life of animals and humans alike. The posterior parietal cortex in primates has been implicated in representing abstract quantity, both continuous (extent) and discrete (number of items), supporting the idea of a putative generalized magnitude system in this brain area. Whether or not single neurons encode different types of quantity, or how quantitative information is represented in the neuronal responses, however, is unknown. We show that length and numerosity are encoded by functionally overlapping groups of parietal neurons. Using a statistical classifier, we found that the activity of populations of quantity-selective neurons contained accurate information about continuous and discrete quantity. Unexpectedly, even neurons that were nonselective according to classical spike-count measures conveyed robust categorical information that predicted the monkeys' quantity judgments. Thus, different information-carrying processes of partly intermingled neuronal networks in the parietal lobe seem to encode various forms of abstract quantity.


Conflict of interest statement

The authors declare no conflict of interest.

Figures

Fig. 1.
Fig. 1.
Delayed match-to-sample protocols and behavioral performance. (A) Length protocol. A trial started when the monkey grasped a lever and maintained fixation. The monkey had to release the lever if the lines in the sample and test displays had the same length and had to continue holding it if they did not (P = 0.5). Nonmatch stimuli consisted of lines that were longer or shorter than the sample line, respectively. (B) Numerosity protocol. Task conditions were identical to the length protocol, but here the monkeys had to match the number of items in the sample and test displays. The physical appearance of the displays varied widely for the same numerosities (see Methods). Nonmatch stimuli showed lower or higher numerosities than the sample numerosity, respectively.
Fig. 2.
Fig. 2.
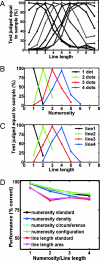
Performance data. (A) Average performance on nine line lengths in purely behavioral sessions. The functions indicate the probability that a monkey judged displays in the test period as containing the same line length as the sample quantity. Line lengths ranged from 0.58° of visual angle in multiples of 0.58° up to 5.22°. The peak of each performance distribution indicates sample length. (B and C) Behavioral performance of both monkeys during recordings for the two types of quantities (B, discrete; C, continuous). Four line lengths (multiples of 0.85° of visual angle) were used during the recording sessions. The color-coded functions indicate the probability that a monkey judged displays in the test period as containing the same quantity as the sample quantity. (D) Average performance of both monkeys in the numerosity and line-length discrimination tasks (standard and control conditions) during the recording sessions. Chance level is 50%.
Fig. 3.
Fig. 3.
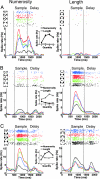
Example neurons exhibiting selectivity for quantity in the sample period. (A) Neuron tuned to numerosity, but not to length. Left and Right illustrate the discharge rates of the same neuron in the numerosity and length protocol, respectively. At the top, the neuronal responses are plotted as dot-raster histograms (each dot represents an action potential in response to the quantity as illustrated by example stimuli to the left and is color-coded accordingly); corresponding averaged spike density functions are shown below (activity to a given quantity averaged over all trials and smoothed by a Gaussian kernel). The first 500 ms represent the fixation period. The area between the two black vertical bars represents the sample stimulus presentation, and the following 1,000 ms indicate the delay phase. Colors correspond to the quantity dimensions. (Inset) Tuning functions of the neuron to numerosity and length in the sample period. (B) Neuron tuned to the third longest line, but not to any tested numerosity (same layout as in A). (C) Example neuron encoding both discrete and continuous quantity (same layout as in A).
Fig. 4.
Fig. 4.
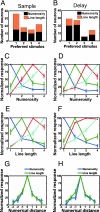
Frequency and characteristics of quantity-selective neurons. (A and B) Frequency distribution of quantity-tuned cells in the sample (A) and delay (B) phases. The absolute number of neurons is plotted for each preferred quantity (from 1 to 4) separately. The colors represent the two types of quantities, continuous (orange) and discrete (black). (C–F) The normalized responses averaged for neurons with the same preferred quantity are plotted separately for discrete (C, sample; D, delay) and continuous (E, sample; F, delay) quantities. All neurons showed a progressive drop-off of the response with increasing distances from the preferred numerosity or line length, resulting in averaged tuning functions that were comparable for neurons tuned to discrete or to continuous quantities. (G and H) Normalized activity for the discrete quantities (in blue) and continuous quantity (in green) as a function of distance from the preferred quantity, for both sample (G) and delay (H).
Fig. 5.
Fig. 5.
Classification performance across the neuronal population. Shown are confusion matrices describing the pattern of quantity classification performed on four different neuronal populations. The rows in each confusion matrix represent the true classes the monkey had seen, and the columns correspond to the output of the classifier. Color codes the classification probability. The eight classes correspond to the eight stimulus quantities: numerosity 1–4 and line length 1 to line length 4, where length 1 is the shortest line (0.85° of visual angle). Thus, the main diagonal shows how often the classifier correctly assigned quantity stimuli to their real category (i.e., accuracy). Averaging the classification probabilities over each diagonal parallel to the main diagonal results in the average performance of the classifier as a function of distance from the real quantity, which is plotted, separately for each stimulus type (length and numerosity, respectively), as a tuning function at each end of the main diagonal (the data points resulting from the misclassifications across stimulus types are not included in the computation of the tuning functions, where only data from within-category classifications, marked in the confusion matrix by a solid black frame, were used). (A) Classification performance on the population of 72 quantity-selective neurons during the sample phase. (B) Classification performance on the population of 59 quantity-selective neurons during the delay period. (C and D) Classification performance based on untuned, task-related neurons. The number of untuned neurons tested in the sample (C) and delay (D) phases was matched to the populations of tuned neurons (A and B).
Fig. 6.
Fig. 6.
Comparison of classification performance based on untuned neurons for correct and error trials (same layout as in Fig. 5). Because of an insufficient number of errors the monkeys made for the smallest line length and numerosity 1, the error trial analysis had to be restricted to the six remaining quantities, resulting in a 6-×-6 confusion matrix with fewer neurons. The classification performance on the main diagonal is represented by the column at the bottom right corner of each confusion matrix. (A and C) Classification performance on the population of 30 untuned neurons during the sample phase whenever the monkeys responded correctly (A) or made judgment errors (C). (A) The classifier's tuning functions show a clear peak along the diagonal for correct trials, indicating significant quantity classification. However, tuning was absent for the same population of neurons whenever the monkeys made errors (C). (B and D) A similar result was found for the 34 neurons in the delay phase; the classifier predicted quantities significantly better than chance based on data from correct trials but failed for those from error trials.

References

    1. Wiese H. Numbers, Language, and the Human Mind. New York: Cambridge Univ Press; 2003.
    1. Woodruff G, Premack D, Kennel K. Science. 1978;202:991–994. - PubMed
    1. VanMarle K, Aw J, McCrink K, Santos LR. J Comp Psychol. 2006;120:416–426. - PubMed
    1. McComb K, Packer C, Pusey A. Anim Behav. 1994;47:379–387.
    1. Wilson ML, Hauser MD, Wrangham RW. Anim Behav. 2001;61:1203–1216.

Publication types