

Dichotomy and perceptual distortions in absolute pitch ability
- PMID: 17724340
- PMCID: PMC1959403
- DOI: 10.1073/pnas.0703868104
Dichotomy and perceptual distortions in absolute pitch ability
Abstract
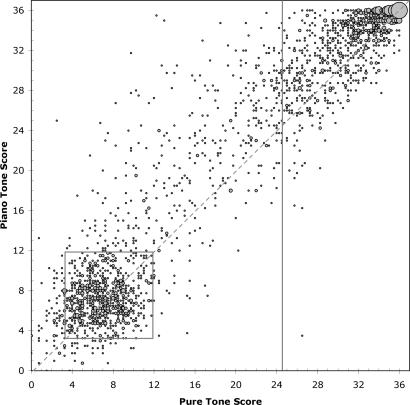
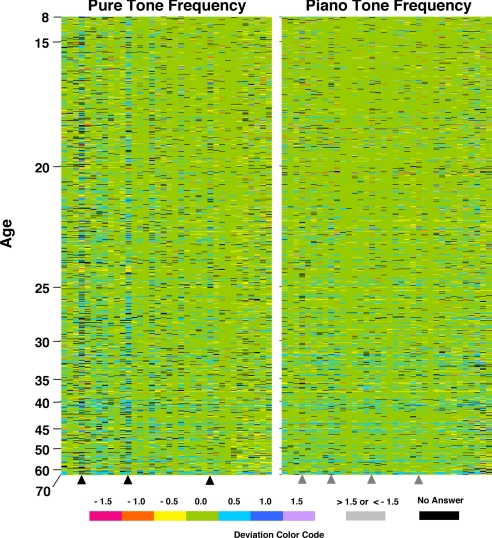
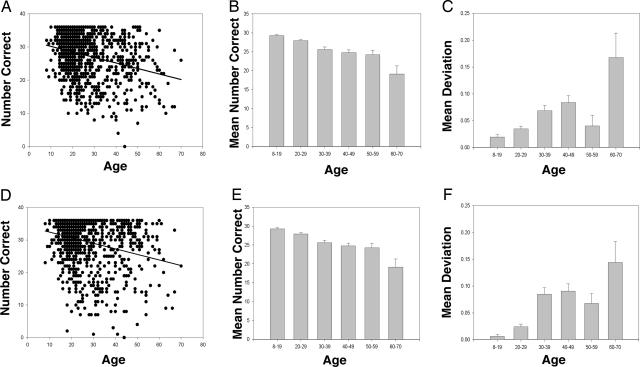
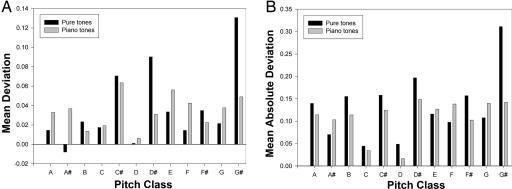
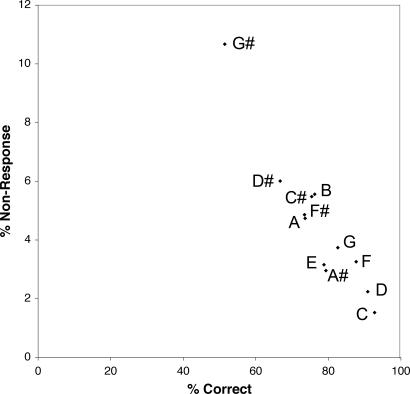
Absolute pitch (AP) is the rare ability to identify the pitch of a tone without the aid of a reference tone. Understanding both the nature and genesis of AP can provide insights into neuroplasticity in the auditory system. We explored factors that may influence the accuracy of pitch perception in AP subjects both during the development of the trait and in later age. We used a Web-based survey and a pitch-labeling test to collect perceptual data from 2,213 individuals, 981 (44%) of whom proved to have extraordinary pitch-naming ability. The bimodal distribution in pitch-naming ability signifies AP as a distinct perceptual trait, with possible implications for its genetic basis. The wealth of these data has allowed us to uncover unsuspected note-naming irregularities suggestive of a "perceptual magnet" centered at the note "A." In addition, we document a gradual decline in pitch-naming accuracy with age, characterized by a perceptual shift in the "sharp" direction. These findings speak both to the process of acquisition of AP and to its stability.
Conflict of interest statement
The authors declare no conflict of interest.
Figures
Comment in
-
Absolute pitch: a special group of ears.Proc Natl Acad Sci U S A. 2007 Sep 11;104(37):14549-50. doi: 10.1073/pnas.0707287104. Epub 2007 Sep 10. Proc Natl Acad Sci U S A. 2007. PMID: 17846431 Free PMC article. No abstract available.
Similar articles
-
[Environmental and electrophysiologic study of absolute hearing].Bull Acad Natl Med. 1990 Jan;174(1):17-26; discussion 26-8. Bull Acad Natl Med. 1990. PMID: 2350709 French.
-
Auditory working memory predicts individual differences in absolute pitch learning.Cognition. 2015 Jul;140:95-110. doi: 10.1016/j.cognition.2015.03.012. Epub 2015 Apr 20. Cognition. 2015. PMID: 25909580
-
Absolute pitch correlates with high performance on interval naming tasks.J Acoust Soc Am. 2011 Dec;130(6):4097-104. doi: 10.1121/1.3652861. J Acoust Soc Am. 2011. PMID: 22225064
-
Absolute pitch: music and beyond.Epilepsy Behav. 2005 Dec;7(4):578-601. doi: 10.1016/j.yebeh.2005.05.019. Epub 2005 Aug 15. Epilepsy Behav. 2005. PMID: 16103017 Review.
-
Neurophysiology and neuroanatomy of pitch perception: auditory cortex.Ann N Y Acad Sci. 2005 Dec;1060:148-74. doi: 10.1196/annals.1360.011. Ann N Y Acad Sci. 2005. PMID: 16597761 Review.
Cited by
-
Individual differences in human frequency-following response predict pitch labeling ability.Sci Rep. 2021 Jul 12;11(1):14290. doi: 10.1038/s41598-021-93312-7. Sci Rep. 2021. PMID: 34253760 Free PMC article.
-
Timbral cues underlie instrument-specific absolute pitch in expert oboists.PLoS One. 2024 Oct 3;19(10):e0306974. doi: 10.1371/journal.pone.0306974. eCollection 2024. PLoS One. 2024. PMID: 39361623 Free PMC article.
-
Enhanced functional networks in absolute pitch.Neuroimage. 2012 Nov 1;63(2):632-40. doi: 10.1016/j.neuroimage.2012.07.030. Epub 2012 Jul 23. Neuroimage. 2012. PMID: 22836173 Free PMC article.
-
Absolute pitch memory: its prevalence among musicians and dependence on the testing context.Psychon Bull Rev. 2014 Apr;21(2):534-42. doi: 10.3758/s13423-013-0487-z. Psychon Bull Rev. 2014. PMID: 23943554
-
Enhanced auditory disembedding in an interleaved melody recognition test is associated with absolute pitch ability.Sci Rep. 2019 May 24;9(1):7838. doi: 10.1038/s41598-019-44297-x. Sci Rep. 2019. PMID: 31127171 Free PMC article.
References
-
- Ward WD. Deutsch D. The Psychology of Music. 2nd Ed. San Diego: Academic; 1999. pp. 265–298.
-
- Zatorre RJ. Nat Neurosci. 2003;6:692–695. - PubMed
-
- Sergeant D. J Res Music Education. 1969;17:135–143.
-
- Takeuchi AH, Hulse SH. Psychol Bull. 1993;113:345–361. - PubMed
-
- Bachem A. J Acous Soc Am. 1955;27:1180–1185.
Publication types
MeSH terms
LinkOut - more resources
Full Text Sources
