

IL-6 modulates sepsis-induced decreases in transcription of hepatic organic anion and bile acid transporters
- PMID: 17724432
- PMCID: PMC2667679
- DOI: 10.1097/shk.0b013e318150762b
IL-6 modulates sepsis-induced decreases in transcription of hepatic organic anion and bile acid transporters
Abstract
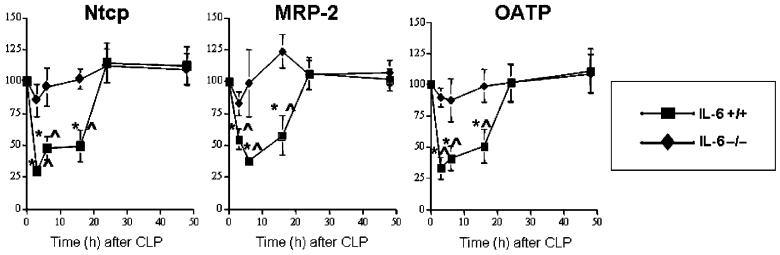
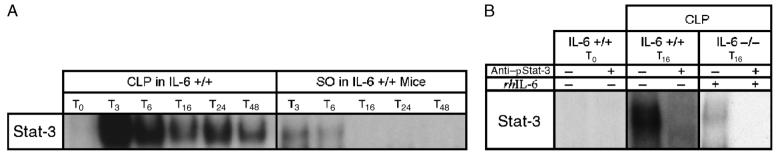
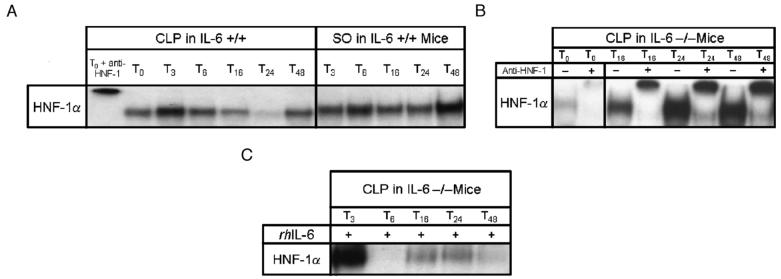
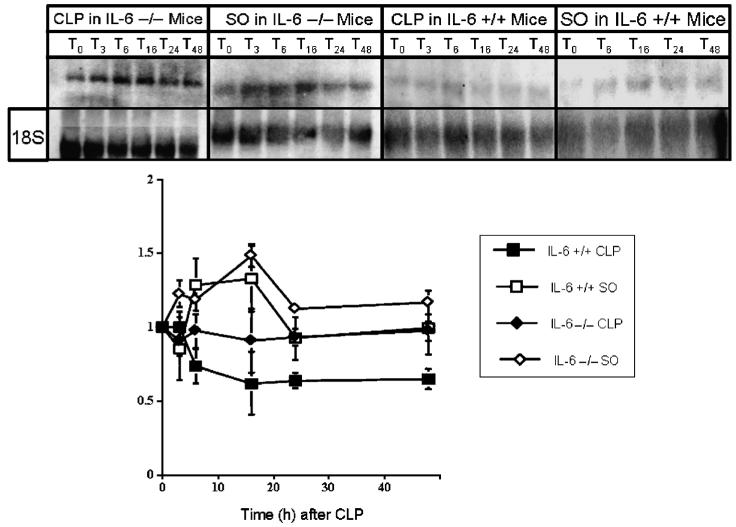
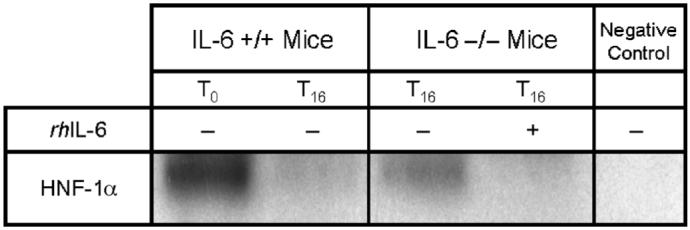
Sepsis, a lethal inflammatory syndrome, is characterized by organ system dysfunction. In the liver, we have observed decreased expression of genes encoding proteins modulating key processes. These include organic anion and bile acid transport. We hypothesized that the inflammatory mediator IL-6 modulates altered expression of several key hepatic genes in sepsis via induction of the intracellular transcription factor signal transducer and activator of transcription (Stat) 3. Sepsis was induced in IL-6 +/+ and IL-6 -/- mice, and expression of the liver-restricted genes encoding the sodium-taurocholate cotransporter (Ntcp), the multidrug resistant protein (MRP) 2 and the organic anion transporter protein (OATP), was determined. As demonstrated previously, cecal ligation and puncture decreases expression of Ntcp, MRP-2, and OATP in IL-6 +/+ mice. Transcription elongation analysis demonstrated that altered expression resulted from decreased transcription. These changes were not observed in IL-6 -/- animals. Cecal ligation and puncture increased the DNA binding activity of Stat-3 in IL-6 +/+ but not IL-6 -/- mice. Because the promoters of Ntcp, MRP-2, and OATP do not contain Stat-3 binding sites, we postulated that altered Ntcp, MRP-2, and OATP expression resulted from activation of hepatocyte nuclear factor (HNF) 1alpha, which is IL-6 dependent. Cecal ligation and puncture decreased HNF-1alpha expression and DNA binding activity in IL-6 +/+ but not IL-6 -/- mice. Recombinant human IL-6 restored the sepsis-induced decrease in Ntcp, MRP-2, OATP, and HNF-1alpha expression in IL-6 -/- mice. We conclude that sepsis decreases the expression of three key hepatic genes via a transcriptional mechanism that is IL-6, Stat-3, and HNF-1alpha dependent.
Figures

Similar articles
-
Intraabdominal sepsis down-regulates transcription of sodium taurocholate cotransporter and multidrug resistance-associated protein in rats.Shock. 2000 Aug;14(2):176-81. doi: 10.1097/00024382-200014020-00017. Shock. 2000. PMID: 10947163
-
Critical role of PPAR-alpha in perfluorooctanoic acid- and perfluorodecanoic acid-induced downregulation of Oatp uptake transporters in mouse livers.Toxicol Sci. 2008 Nov;106(1):37-45. doi: 10.1093/toxsci/kfn161. Epub 2008 Aug 14. Toxicol Sci. 2008. PMID: 18703564 Free PMC article.
-
Role of nuclear receptors and hepatocyte-enriched transcription factors for Ntcp repression in biliary obstruction in mouse liver.Am J Physiol Gastrointest Liver Physiol. 2005 Nov;289(5):G798-805. doi: 10.1152/ajpgi.00319.2004. Epub 2005 Jul 7. Am J Physiol Gastrointest Liver Physiol. 2005. PMID: 16002565
-
Cytokine-independent repression of rodent Ntcp in obstructive cholestasis.Hepatology. 2005 Mar;41(3):470-7. doi: 10.1002/hep.20594. Hepatology. 2005. PMID: 15723437
-
Hepatobiliary organic anion transporters are differentially regulated in acute toxic liver injury induced by carbon tetrachloride.J Hepatol. 2002 Aug;37(2):198-205. doi: 10.1016/s0168-8278(02)00108-3. J Hepatol. 2002. PMID: 12127424
Cited by
-
CD4 and CD8 T Cell Memory Interactions Alter Innate Immunity and Organ Injury in the CLP Sepsis Model.Front Immunol. 2020 Nov 20;11:563402. doi: 10.3389/fimmu.2020.563402. eCollection 2020. Front Immunol. 2020. PMID: 33329524 Free PMC article.
-
T cell activation and IFNγ modulate organ dysfunction in LPS-mediated inflammation.J Leukoc Biol. 2022 Aug;112(2):221-232. doi: 10.1002/JLB.4HI0921-492R. Epub 2022 Feb 9. J Leukoc Biol. 2022. PMID: 35141943 Free PMC article.
-
Differential transcriptional characteristics of small and large biliary epithelial cells derived from small and large bile ducts.Am J Physiol Gastrointest Liver Physiol. 2010 Sep;299(3):G769-77. doi: 10.1152/ajpgi.00237.2010. Epub 2010 Jun 24. Am J Physiol Gastrointest Liver Physiol. 2010. PMID: 20576918 Free PMC article.
-
Orexinergic activity modulates altered vital signs and pituitary hormone secretion in experimental sepsis.Crit Care Med. 2013 Nov;41(11):e368-75. doi: 10.1097/CCM.0b013e31828e9843. Crit Care Med. 2013. PMID: 24105451 Free PMC article.
-
Expression of bile acid transporting proteins in Barrett's esophagus and esophageal adenocarcinoma.Am J Gastroenterol. 2009 Feb;104(2):302-9. doi: 10.1038/ajg.2008.85. Epub 2009 Jan 27. Am J Gastroenterol. 2009. PMID: 19174784 Free PMC article.
References
-
- Angus DC, Linde-Zwirble WT, Lidicker J, Clermont G, Carcillo J, Pinsky MR. Epidemiology of severe sepsis in the United States: analysis of incidence, outcome, and associated costs of care. Crit Care Med. 2001;29:1303–1310. - PubMed
-
- Andrejko KM, Deutschman CS. Altered hepatic gene expression in fecal peritonitis: changes in transcription of gluconeogenic, beta-oxidative, and ureagenic genes. Shock. 1997;7:164–169. - PubMed
-
- Deutschman CS, Haber BA, Andrejko KM, Cressman DE, Harrison R, Elenko E, Taub R. Increased expression of cytokine-induced neutrophil chemoattractant (CINC) in septic rat liver. Am J Physiol. 1996;271:R593–R600. - PubMed
-
- Deutschman CS, DeMaio A, Buchman TG, Clemens MG. Sepsis-induced alterations in phosphoenolpyruvate carboxykinase expression: the role of insulin and glucagon. Circ Shock. 1993;40:295–302. - PubMed
-
- Deutschman CS, Andrejko KM, Haber BA, Elenko E, Harrison R, Taub R. Sepsis-induced depression of rat glucose-6-phosphatase gene expression and activity. Am J Physiol. 1997;273:R1709–R1718. - PubMed
Publication types
MeSH terms
Substances
Grants and funding
LinkOut - more resources
Full Text Sources
Medical
Research Materials
Miscellaneous
