. 2007 Aug 28:8:312.
doi: 10.1186/1471-2105-8-312.

MaxAlign: maximizing usable data in an alignment

Affiliations

MaxAlign: maximizing usable data in an alignment

Rodrigo Gouveia-Oliveira et al. BMC Bioinformatics. .

Abstract

Background: The presence of gaps in an alignment of nucleotide or protein sequences is often an inconvenience for bioinformatical studies. In phylogenetic and other analyses, for instance, gapped columns are often discarded entirely from the alignment.

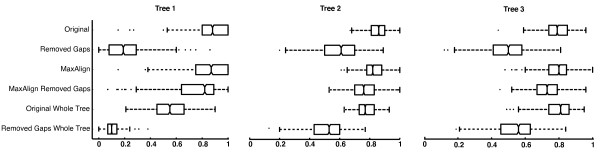
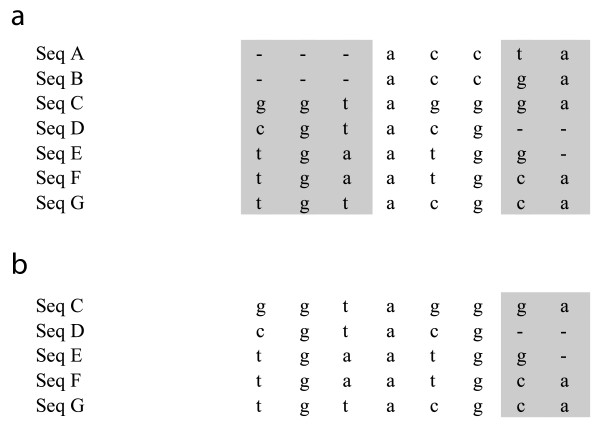
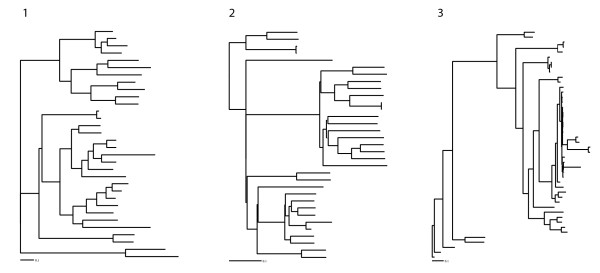
Results: MaxAlign is a program that optimizes the alignment prior to such analyses. Specifically, it maximizes the number of nucleotide (or amino acid) symbols that are present in gap-free columns - the alignment area - by selecting the optimal subset of sequences to exclude from the alignment. MaxAlign can be used prior to phylogenetic and bioinformatical analyses as well as in other situations where this form of alignment improvement is useful. In this work we test MaxAlign's performance in these tasks and compare the accuracy of phylogenetic estimates including and excluding gapped columns from the analysis, with and without processing with MaxAlign. In this paper we also introduce a new simple measure of tree similarity, Normalized Symmetric Similarity (NSS) that we consider useful for comparing tree topologies.

Conclusion: We demonstrate how MaxAlign is helpful in detecting misaligned or defective sequences without requiring manual inspection. We also show that it is not advisable to exclude gapped columns from phylogenetic analyses unless MaxAlign is used first. Finally, we find that the sequences removed by MaxAlign from an alignment tend to be those that would otherwise be associated with low phylogenetic accuracy, and that the presence of gaps in any given sequence does not seem to disturb the phylogenetic estimates of other sequences. The MaxAlign web-server is freely available online at http://www.cbs.dtu.dk/services/MaxAlign where supplementary information can also be found. The program is also freely available as a Perl stand-alone package.


Figures

Figure 1
Figure 1
Accuracy in phylogenetic inference. Comparison of phylogenetic accuracy obtained with different data sets. Accuracy is measured as tree similarity between the true tree (used for simulating the data set) and the reconstructed tree. Each line shows the distribution of the accuracy results from 1000 different data sets, in the form of a box plot. The box has lines at the lower quartile, median and upper quartile. The whiskers extend from each quartile to the most extreme values within 1.5 times the interquartile range. Outliers falling outside this range are marked with dots. The datasets are in the same order (from top to bottom) as in table 2: The top two rows show the original dataset without and with removal of gapped columns, respectively. The third and fourth rows show the equivalent MaxAlign datasets. The trees in the top four rows are being evaluated on the subset of sequences shared by all data sets ("Subset"), while the lower two rows show the results for original datasets when evaluated on the full set of sequences ("All").
Figure 2
Figure 2
Example of MaxAlign processing. Example alignment, before (a) and after (b) MaxAlign. In the original unprocessed alignment (a), only the three middle columns would be included in a subsequent analysis (alignment area = 3 rows × 7 columns = 21). The first three columns have the same gap pattern. After MaxAlign processing (b) (resulting in removal of sequences A and B) only the last two columns would be excluded by having gaps (alignment area = 5 rows × 6 columns = 30).
Figure 3
Figure 3
Tree topologies used to simulate alignments. The trees used to simulated the alignments. From 1 to 3: TF101002, TF101523 and TF105969.

References

    1. Bishop MJ, Thompson EA. Maximum likelihood alignment of DNA sequences. J Mol Biol. 1986;190:159–165. doi: 10.1016/0022-2836(86)90289-5. - DOI - PubMed
    1. Thorne JL, Kishino H, Felsenstein J. An evolutionary model for maximum likelihood alignment of DNA sequences. J Mol Evol. 1991;33:114–124. doi: 10.1007/BF02193625. - DOI - PubMed
    1. Thorne JL, Kishino H, Felsenstein J. Inching toward reality: an improved likelihood model of sequence evolution. J Mol Evol. 1992;34:3–16. doi: 10.1007/BF00163848. - DOI - PubMed
    1. Swofford DL. In: PAUP*: Phylogenetic analysis using parsimony and other methods. Associates S, editor. Sunderland, Massachussets ; 1998. - PubMed
    1. Yang Z. PAML: a program package for phylogenetic analysis by maximum likelihood. Comput Appl Biosci. 1997;13:555–556. - PubMed

Publication types

MeSH terms

LinkOut - more resources