

Widespread endocrine disruption and reproductive impairment in an estuarine fish population exposed to seasonal hypoxia
- PMID: 17725976
- PMCID: PMC2279220
- DOI: 10.1098/rspb.2007.0921
Widespread endocrine disruption and reproductive impairment in an estuarine fish population exposed to seasonal hypoxia
Abstract
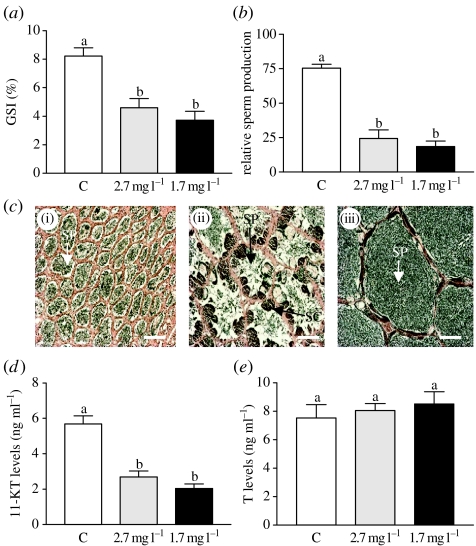
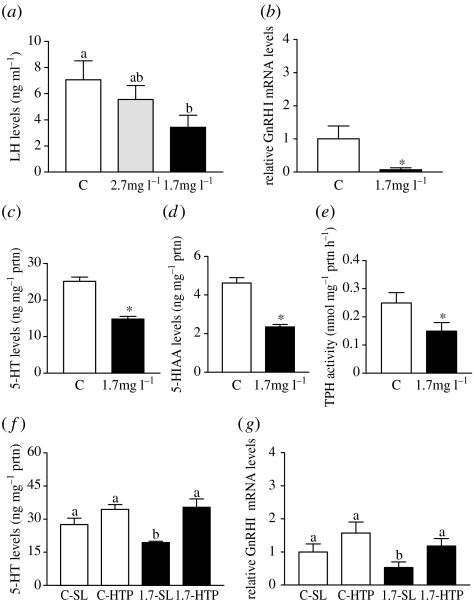
The long-term effects on marine fish populations of the recent increase worldwide in the incidence of coastal hypoxia are unknown. Here we show that chronic environmental exposure of Atlantic croaker (Micropogonias undulatus) to hypoxia in a Florida estuary caused marked suppression of ovarian and testicular growth which was accompanied by endocrine disruption. Laboratory hypoxia studies showed that the endocrine disruption was associated with impairment of reproductive neuroendocrine function and decreases in hypothalamic serotonin (5-HT) content and the activity of the 5-HT biosynthetic enzyme, tryptophan hydroxylase. Pharmacological restoration of hypothalamic 5-HT levels also restored neuroendocrine function, indicating that the stimulatory serotonergic neuroendocrine pathway is a major site of hypoxia-induced inhibition. Inhibition of tryptophan hydroxylase activity to downregulate reproductive activity could have evolved as an adaptive mechanism to survive periodic hypoxia, but in view of the recent increased incidence of coastal hypoxia could become maladaptive and potentially affect fish population abundance and threaten valuable fishery resources.
Figures
Similar articles
-
Tryptophan hydroxylase: a target for neuroendocrine disruption.J Toxicol Environ Health B Crit Rev. 2011;14(5-7):473-94. doi: 10.1080/10937404.2011.578563. J Toxicol Environ Health B Crit Rev. 2011. PMID: 21790322 Review.
-
Disruption of neuroendocrine control of luteinizing hormone secretion by aroclor 1254 involves inhibition of hypothalamic tryptophan hydroxylase activity.Biol Reprod. 2001 Mar;64(3):955-64. doi: 10.1095/biolreprod64.3.955. Biol Reprod. 2001. PMID: 11207213
-
Lead and Aroclor 1254 disrupt reproductive neuroendocrine function in Atlantic croaker.Mar Environ Res. 2000 Jul-Dec;50(1-5):119-23. doi: 10.1016/s0141-1136(00)00108-2. Mar Environ Res. 2000. PMID: 11460677
-
Region-wide impairment of Atlantic croaker testicular development and sperm production in the northern Gulf of Mexico hypoxic dead zone.Mar Environ Res. 2010;69 Suppl:S59-62. doi: 10.1016/j.marenvres.2009.10.017. Epub 2009 Oct 25. Mar Environ Res. 2010. PMID: 19931178
-
Health effects of endocrine-disrupting chemicals on wildlife, with special reference to the European situation.Crit Rev Toxicol. 2000 Jan;30(1):71-133. doi: 10.1080/10408440091159176. Crit Rev Toxicol. 2000. PMID: 10680769 Review.
Cited by
-
Molecular Characterization and Expression of Cytochrome P450 Aromatase in Atlantic Croaker Brain: Regulation by Antioxidant Status and Nitric Oxide Synthase During Hypoxia Stress.Front Physiol. 2021 Aug 9;12:720200. doi: 10.3389/fphys.2021.720200. eCollection 2021. Front Physiol. 2021. PMID: 34434121 Free PMC article.
-
Acute embryonic anoxia exposure favours the development of a dominant and aggressive phenotype in adult zebrafish.Proc Biol Sci. 2017 Jan 11;284(1846):20161868. doi: 10.1098/rspb.2016.1868. Proc Biol Sci. 2017. PMID: 28077765 Free PMC article.
-
Impaired megabenthic community structure caused by summer hypoxia in a eutrophic coastal bay.Ecotoxicology. 2010 Mar;19(3):479-92. doi: 10.1007/s10646-009-0438-7. Ecotoxicology. 2010. PMID: 19936920
-
Assessment of hypoxia-inducible factor-1α mRNA expression in mantis shrimp as a biomarker of environmental hypoxia exposure.Biol Lett. 2012 Apr 23;8(2):278-81. doi: 10.1098/rsbl.2011.0887. Epub 2011 Oct 26. Biol Lett. 2012. PMID: 22031724 Free PMC article.
-
Hypoxia turns genotypic female medaka fish into phenotypic males.Ecotoxicology. 2014 Sep;23(7):1260-9. doi: 10.1007/s10646-014-1269-8. Epub 2014 Jul 11. Ecotoxicology. 2014. PMID: 25011919
References
-
- Allen Y, Scott A.P, Matthiessen P, Haworth S, Thain J.E, Feist S. Survey of estrogenic activity in United Kingdom estuarine and coastal waters and its effects on gonadal development of the flounder Platichthys flesus. Environ. Toxicol. Chem. 1999;18:1791–1800. doi:10.1897/1551-5028(1999)018<1791:SOEAIU>2.3.CO;2 - DOI
-
- Bell G.W, Eggleston D.B. Species-specific avoidance responses by blue crabs and fish to chronic and episodic hypoxia. Mar. Biol. 2005;146:761–770. doi:10.1007/s00227-005-1614-9 - DOI
-
- Billard R, Bry C, Gillet C. Stress, environment and reproduction in teleost fish. In: Pickering A.D, editor. Stress and fish. Academic Press; London, UK: 1981. pp. 185–208.
-
- Brown R.M, Kehr W, Carlsson A. Functional and biochemical aspects of catecholamine metabolism in brain under hypoxia. Brain Res. 1975;85:491–509. doi:10.1016/0006-8993(75)90822-7 - DOI - PubMed
-
- Brown-Peterson N, Thomas P, Arnold C.R. Reproductive biology of the spotted seatrout, Cynoscion nebulosus, in south Texas. Fish. Bull. 1988;86:373–388.
Publication types
MeSH terms
Substances
LinkOut - more resources
Full Text Sources
