. 2007 Sep 4;104(36):14454-9.
doi: 10.1073/pnas.0703882104. Epub 2007 Aug 28.

Breaking up the correlation between efficacy and toxicity for nonviral gene delivery

Affiliations

Breaking up the correlation between efficacy and toxicity for nonviral gene delivery

Miriam Breunig et al. Proc Natl Acad Sci U S A. .

Abstract

Nonviral nucleic acid delivery to cells and tissues is considered a standard tool in life science research. However, although an ideal delivery system should have high efficacy and minimal toxicity, existing materials fall short, most of them being either too toxic or little effective. We hypothesized that disulfide cross-linked low-molecular-weight (MW) linear poly(ethylene imine) (MW<4.6 kDa) would overcome this limitation. Investigations with these materials revealed that the extracellular high MW provided outstandingly high transfection efficacies (up to 69.62+/-4.18% in HEK cells). We confirmed that the intracellular reductive degradation produced mainly nontoxic fragments (cell survival 98.69+/-4.79%). When we compared the polymers in >1,400 individual experiments to seven commercial transfection reagents in seven different cell lines, we found highly superior transfection efficacies and substantially lower toxicities. This renders reductive degradation a highly promising tool for the design of new transfection materials.


Conflict of interest statement

The authors declare no conflict of interest.

Figures

Fig. 1.
Fig. 1.
Schematic representation of the synthesis of biodegradable PEIs. LRx-lPEIy (A) and BCx-lPEIy (B) were prepared by cross-linking lPEI with 3,3′-dithiodipropionic acid di(N-succinimidyl ester) or a mixture of N, N′-bis-(tert-butoxycarbonyl)cystine and 4-(4,6-dimethoxy[1.3.5]triazin-2-yl)4-methyl-morpholiniumchlorid hydrate (DMT-MM), respectively, at various molar ratios.
Fig. 2.
Fig. 2.
Uptake of polyplexes into CHO-K1 cells. (A) Observation of LR3-lPEI2.6-polyplexes formed at NP 18 in CHO-K1 cells 3 h after transfection by CLSM. The larger green dots (arrow) were polyplex aggregates that were not taken up by cells. The picture is an overlay of transmitted light and fluorescence image. (Scale bar, 10 μm.) (B and C) Uptake of polyplexes prepared with YOYO-1-labeled DNA and LR3-lPEI2.6 or BC8-LPEI2.6 in whole cells (■) or nuclei (□) after 6 h, as determined by flow cytometry. (B) Fluorescent cells/nuclei with polyplexes indicates the percentage of cells/nuclei that show a fluorescence because of intracellular/intranuclear YOYO-1-labeled DNA. (C) The mean fluorescence intensity is represented from those cells or nuclei that have incorporated YOYO-1-labeled DNA. Statistically significant differences of pairs are denoted by ★ (P < 0.01).
Fig. 3.
Fig. 3.
Effect of reduced intracellular NADPH/H+ concentration, and hence reducing potential, on the transfection efficiency and mean fluorescence intensity in CHO-K1 cells. Polyplexes were prepared with either LR3-lPEI2.6 (■) or BC8-lPEI2.6 (□). Duroquinone at a concentration of 50 μM was added to the cells 1 hour before transfection. (A) Values represent the EGFP-positive cells as means ± SD as determined by flow cytometry 6 h and 24 h after transfection. (B) Values represent the corresponding mean fluorescence intensity of EGFP-positive cells as determined by flow cytometry 6 and 24 h after transfection. Statistically significant differences compared with untreated (without duroquinone) cells are denoted by formula image 
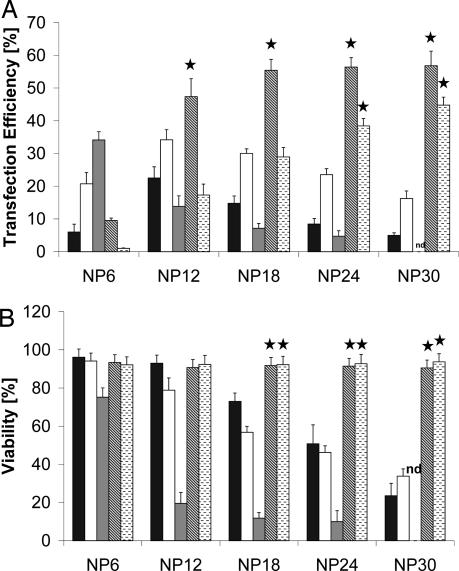
(P < 0.05) or ★ (P < 0.01).
Fig. 4.
Fig. 4.
Intracellular trafficking of polyplexes. (A and B) Tracking of Alexa Fluor 543-labeled plasmid DNA (shown in red) complexed with LR3-lPEI2.6 (A) or BC8-lPEI2.6 (B) cells by CLSM. The acidic organelles of CHO-K1 cells were stained with quinacrine (depicted in turquoise). Most polyplexes were colocalized with acidic vesicles, some examples are indicated by arrows. The larger red dots were polyplex aggregates that were not taken up by cells. Pictures are an overlay of transmitted light and fluorescence images. (Scale bars, 10 μm.) (C) The effect of the lysosomotropic agent sucrose at 5 mM (white bars) on EGFP expression of polyplexes prepared with LR3-lPEI2.6 or BC8-lPEI2.6 compared with transfection without sucrose (black bars) determined by flow cytometry. No statistically significant differences could be found with and without sucrose.
Fig. 5.
Fig. 5.
Comparison with standard polymer-based transfection reagents. Transfection efficiency (A) and corresponding cell viability (B) of bPEI 25-kDa (black bars), lPEI 22 kDa (white bars), ExGen (gray bars), LR3-lPEI2.6 (diagonally hatched bars), and BC8-lPEI2.6 (horizontally hatched bars) complexed with pEGFP-N1 in CHO-K1 cells as determined by flow cytometry. NP ratios at which biodegradable PEIs were statistically significant different compared with all other polymers are denoted by ★ (P < 0.01).
Fig. 6.
Fig. 6.
Comparison of biodegradable PEIs with commercially available transfection reagents. (A and B) EGFP-positive cells expressed as maximal transfection efficiency (A) and corresponding cell viability (B) of various biodegradable PEIs and commercially available transfection reagents complexed with pEGFP-N1 in (from left to right) CHO-K1 (diagonally hatched bars), COS-7 (horizontally hatched bars), NIH/3T3 (black bars), HepG2 (horizontally striped bars), HCT116 (white bars), HeLa (diamond-hatched bars), and HEK-293 (gray bars) cells as determined by flow cytometry. (C) Transfection efficiency under conditions where cell viability is >90%. Statistically significant differences of biodegradable PEIs compared with other transfection reagents are denoted by formula image 
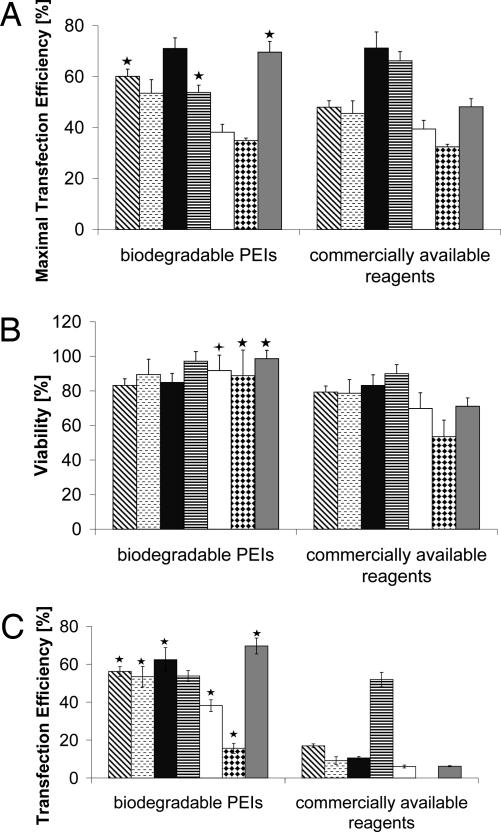
(P < 0.05) or by ★ (P < 0.01).

Similar articles

Cited by

References

    1. Lv H, Zhang S, Wang B, Cui S, Yan J. J Control Release. 2006;114:100–109. - PubMed
    1. Wagner E, Kloeckner J. Adv Polym Sci. 2006;192:135–173.
    1. Park TG, Jeong JH, Kim SW. Adv Drug Deliv Rev. 2006;58:467–486. - PubMed
    1. Hunter AC. Adv Drug Deliv Rev. 2006;58:1523–1531. - PubMed
    1. Lungwitz U, Breunig M, Blunk T, Gopferich A. Eur J Pharm Biopharm. 2005;60:247–266. - PubMed

Publication types