. 2007 Sep 4;104(36):14418-23.
doi: 10.1073/pnas.0703126104. Epub 2007 Aug 28.

T cell activation requires mitochondrial translocation to the immunological synapse

Affiliations

T cell activation requires mitochondrial translocation to the immunological synapse

Ariel Quintana et al. Proc Natl Acad Sci U S A. .

Abstract

T helper (Th) cell activation is required for the adaptive immune response. Formation of the immunological synapse (IS) between Th cells and antigen-presenting cells is essential for Th cell activation. IS formation induces the polarization and redistribution of many signaling molecules; however, very little is known about organelle redistribution during IS formation in Th cells. We show that formation of the IS induced cytoskeleton-dependent mitochondrial redistribution to the immediate vicinity of the IS. Using total internal reflection microscopy, we found that upon stimulation, the distance between the IS and mitochondria was decreased to values<200 nm. Consequently, mitochondria close to the IS took up more Ca2+ than the ones farther away from the IS. The redistribution of mitochondria to the IS was necessary to maintain Ca2+ influx across the plasma membrane and Ca2+-dependent Th cell activation. Our results suggest that mitochondria are part of the signaling complex at the IS and that their localization close to the IS is required for Th cell activation.


Conflict of interest statement

The authors declare no conflict of interest.

Figures
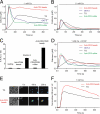
Fig. 1.
Fig. 1.
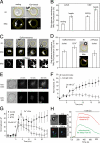
Efficient Ca2+-dependent Th cell activation after formation of the IS requires mitochondrial Ca2+ uptake. (A) Average [Ca2+]i of Jurkat T cells. The [Ca2+]i plateau (sustained [Ca2+]i) at 800–900 s was analyzed for anti-CD3 beads (1,361 ± 7 nM, 183 cells), 1 μM TG (735 ± 39 nM, 1,525 cells), 5 μg/ml OKT-3 (470 ± 15 nM, 321 cells), or 5 μg/ml anti-CD3 mAbs (464 ± 8 nM, 170 cells). Bead-induced [Ca2+]i was significantly higher than TG-, OKT-3-, or anti-CD3-induced [Ca2+]i (unpaired Student's t test, P < 2.5 × 10⁻¹⁶). (B) Average [Ca2+]i of Jurkat T cells in 0 mM Ca2+ Ringer's solution to assess the efficiency of Ca2+ store depletion. (C) Average of cell proliferation of Th cells from four blood donors after a 5-day incubation with 2 μg/ml phytohemagglutinin plus 10 units/ml IL-2 (positive control), anti-intercellular adhesion molecule beads (negative control), 5 μg/ml anti-CD3 and anti-CD28 mAbs (costimulation) in solution, or anti-CD3/CD28 beads. Data are shown as percentage of Th cell proliferation regarding the cell proliferation measured at day 0. Bead stimulation was significantly better than antibody stimulation (Mann–Whitney test, P = 0.000032). (D) Average [Ca2+]i of Jurkat T cells in the presence of 1 μM carbonyl cyanide m-chlorophenylhydrazone (CCCP). No significant difference was found between the sustained Ca2+ signals (P > 0.1). (E) Infrared images and rhod-2 fluorescence pictures of cells stimulated by either TG or anti-CD3 beads. Warmer colors indicate higher rhod-2 fluorescence. (F) Statistical analysis of the normalized rhod-2 fluorescence from T cells stimulated by either TG (37 mitochondrial spots) or anti-CD3 beads (90 mitochondrial spots).
Fig. 2.
Fig. 2.
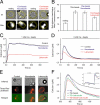
Different intracellular localization profile of mitochondria in HeLa and T cells. (A) Confocal fluorescence image from a single MitoTracker Green/AM-loaded HeLa cell. (B) Confocal fluorescence image of MitoTracker/AM/di-8-ANEPPS colabeled Jurkat T cells. (C) Two examples of EM images obtained from Jurkat T cells. N, nucleus; M, mitochondria; PM, plasma membrane. (D) Infrared and MitoTracker fluorescence images from MitoTracker Green/AM-loaded Jurkat T cells obtained by epifluorescence microscopy. Scale bars indicate magnifications.
Fig. 3.
Fig. 3.
Focal stimulation of TCR activates mitochondrial translocation not only toward the plasma membrane but also to the IS. (A) Infrared and fluorescence images from MitoTracker Green/AM-loaded Jurkat T cells before and 15 min after stimulation with anti-CD3 beads. (B) Statistical analysis of the subplasma membrane localization of mitochondria (<0.99 μm beneath the plasma membrane) in Jurkat (31 cells) and CD4+ (18 cells) T cells before (resting) and 15 min after stimulation with anti-CD3 beads. Bead stimulation was significantly different from resting conditions (paired Student's t test; Jurkat, P = 7 × 10⁻⁵; CD4+, P = 3 × 10⁻⁶). (C) Epifluorescence microscopy and infrared pictures of MitoTracker Green during anti-CD3 bead stimulation. The yellow ring labels the plasma membrane. Shown are two-photon microscopy pictures of a Jurkat T cell stained with MitoTracker/AM and anti-CD45-Alexa Fluor 488 mAb (for the plasma membrane). (D) Percentage of mitochondria at the IS (see Inset, area limited by red line) compared with the net subplasma membrane MitoTracker fluorescence (<0.99 μm beneath the plasma membrane) in Jurkat and CD4+ T cells after anti-CD3 bead stimulation. (E) TIRF microscopy pictures of single MitoTracker Green/AM-loaded Jurkat T cells that were settled on anti-CD3 or anti-IgG mAb-coated coverslips in the absence of extracellular Ca2+ solution for 4 min and then (at 0 min) exposed to 20 mM Ca2+. (F) Statistical analysis of the normalized MitoTracker fluorescence from 21 and nine cells analyzed as the one in E. (G) Statistical analysis of the normalized MitoTracker fluorescence from TIRF experiments. Jurkat T cells were settled on anti-CD3 mAb-coated coverslips in the absence of extracellular Ca2+ solution for 15 min and then (at 0 min) exposed to 20 mM Ca2+ solution. Control (47 cells), 2-APB-treated (50 μM, 10 cells) or BTP2-treated (100 nM overnight incubation, 20 cells) cells are shown. (H) Infrared images and rhod-2 pictures of T cells stimulated by anti-CD3 beads. Red arrow indicates the position of a mitochondrial cluster beneath the IS, and green arrows indicate the position of mitochondrial populations farther away from the IS. Also shown is kinetic analysis of the normalized rhod-2 fluorescence from mitochondria localized either close to or farther away from the IS (seven cells).
Fig. 4.
Fig. 4.
Sustained [Ca2+]i after IS formation requires actin cytoskeleton rearrangement-dependent mitochondrial translocation to the IS. (A) Infrared and MitoTracker fluorescence images from single MitoTracker Green/AM-loaded Jurkat T cells before and after stimulation with anti-CD3 beads in the presence of 2 μM nocodazole after a preincubation period for 35 min or in the presence of 10 μg/ml latrunculin B after a preincubation period for 15 min. (B) Statistical analysis of the subplasma membrane localization of mitochondria in Jurkat T cells (<0.99 μm beneath the plasma membrane): resting (86 cells), beads (31 cells), beads plus nocodazole (36 cells), and beads plus latrunculin B (19 cells). Bead stimulation was significantly different from either resting conditions (unpaired Student's t test, P = 2 × 10⁻⁶) or cells stimulated in the presence of latrunculin B (P = 0.009). (C) Average [Ca2+]i of Jurkat T cells stimulated with anti-CD3 beads (control, 1,361 cells) or with anti-CD3 beads in the presence of nocodazole (178 cells) or latrunculin B (106 cells). (D) Average [Ca2+]i of Jurkat T cells stimulated with anti-CD3 beads (control, 104 cells) or with anti-CD3 beads in the presence of nocodazole (52 cells) or latrunculin B (38 cells). (E) Infrared, fluorescence, and merged images from single Jurkat T cells in which the actin cytoskeleton was stained by Texas red phalloidin after the stimulation with anti-CD3 beads (control) or with anti-CD3 beads in the presence of nocodazole or latrunculin B. (F) Average [Ca2+]i of Jurkat T cells stimulated with TG or TG plus anti-CD3 beads in the presence (290 or 270 cells, respectively) or absence (260 or 300 cells, respectively) of latrunculin B. (Inset) The complete experiments. The influx and sustained phase of the Ca2+ signals are magnified.
Fig. 5.
Fig. 5.
Model for Ca2+-dependent T cell activation. After formation of the IS, many mitochondria are translocated into the vicinity of the IS. This close coupling facilitates a larger and more sustained Ca2+ influx and the concomitant activation of transcription factors like NFAT, AP1, and NF-κB by reducing the Ca2+-dependent CRAC/Orai1 channel inactivation of channels localized close to or within the IS. CRAC/Orai1 channels localized far away from the IS (and most likely not close to mitochondria) inactivate much more rapidly and do not contribute to sustained Ca2+ signals.

Comment in

References

    1. Friedl P, den Boer AT, Gunzer M. Nat Rev Immunol. 2005;5:532–545. - PubMed
    1. Jacobelli J, Andres PG, Boisvert J, Krummel MF. Curr Opin Immunol. 2004;16:345–352. - PubMed
    1. Grakoui A, Bromley SK, Sumen C, Davis MM, Shaw AS, Allen PM, Dustin ML. Science. 1999;285:221–227. - PubMed
    1. Qi SY, Groves JT, Chakraborty AK. Proc Natl Acad Sci USA. 2001;98:6548–6553. - PMC - PubMed
    1. Billadeau DD, Nolz JC, Gomez TS. Nat Rev Immunol. 2007;7:131–143. - PubMed

Publication types