. 2007 Aug 29;2(8):e800.
doi: 10.1371/journal.pone.0000800.

Contribution of exogenous genetic elements to the group A Streptococcus metagenome

Affiliations

Contribution of exogenous genetic elements to the group A Streptococcus metagenome

Stephen B Beres et al. PLoS One. .

Abstract

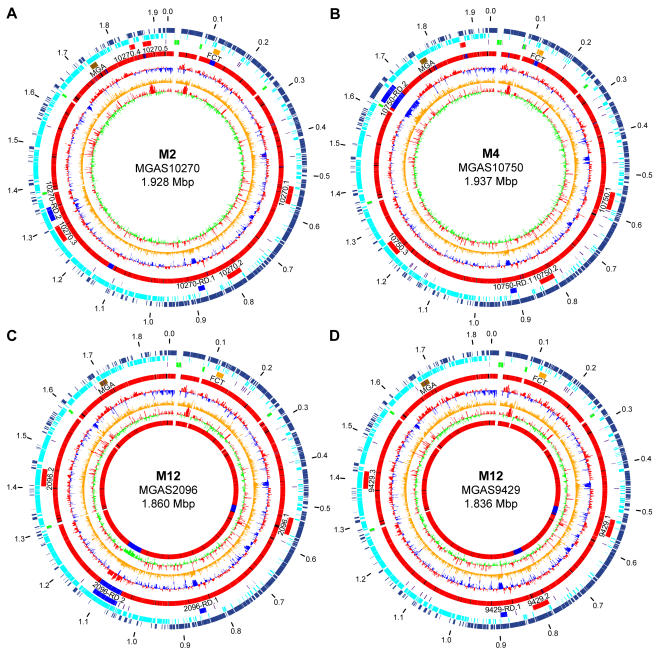
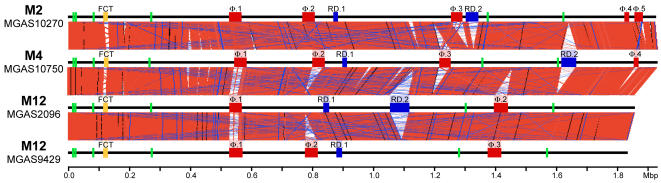
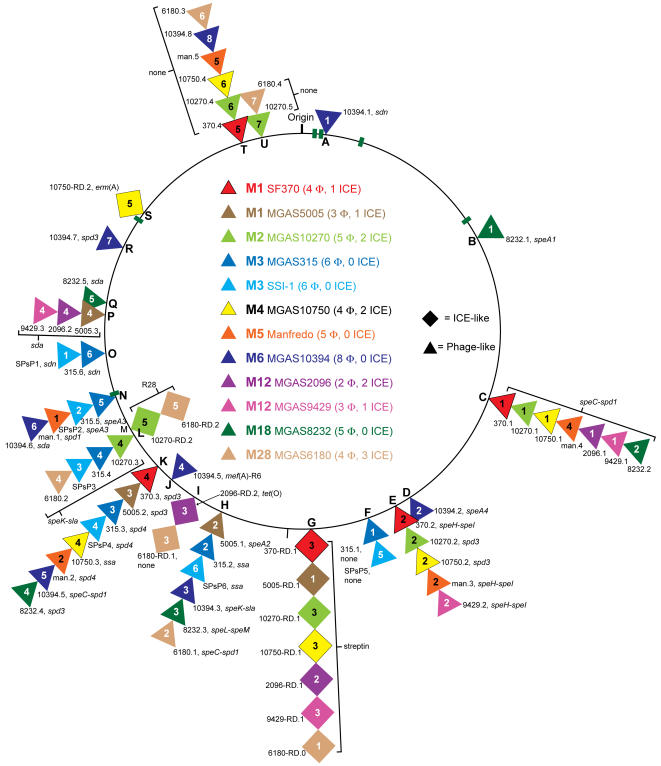
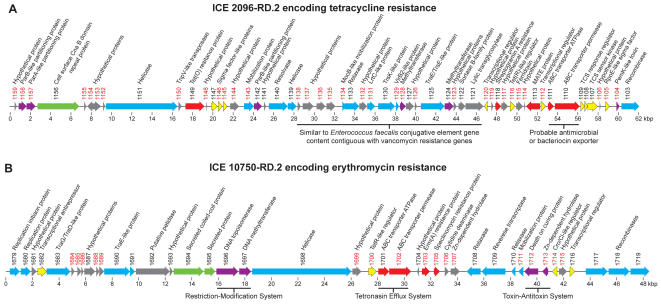
Variation in gene content among strains of a bacterial species contributes to biomedically relevant differences in phenotypes such as virulence and antimicrobial resistance. Group A Streptococcus (GAS) causes a diverse array of human infections and sequelae, and exhibits a complex pathogenic behavior. To enhance our understanding of genotype-phenotype relationships in this important pathogen, we determined the complete genome sequences of four GAS strains expressing M protein serotypes (M2, M4, and 2 M12) that commonly cause noninvasive and invasive infections. These sequences were compared with eight previously determined GAS genomes and regions of variably present gene content were assessed. Consistent with the previously determined genomes, each of the new genomes is approximately 1.9 Mb in size, with approximately 10% of the gene content of each encoded on variably present exogenous genetic elements. Like the other GAS genomes, these four genomes are polylysogenic and prophage encode the majority of the variably present gene content of each. In contrast to most of the previously determined genomes, multiple exogenous integrated conjugative elements (ICEs) with characteristics of conjugative transposons and plasmids are present in these new genomes. Cumulatively, 242 new GAS metagenome genes were identified that were not present in the previously sequenced genomes. Importantly, ICEs accounted for 41% of the new GAS metagenome gene content identified in these four genomes. Two large ICEs, designated 2096-RD.2 (63 kb) and 10750-RD.2 (49 kb), have multiple genes encoding resistance to antimicrobial agents, including tetracycline and erythromycin, respectively. Also resident on these ICEs are three genes encoding inferred extracellular proteins of unknown function, including a predicted cell surface protein that is only present in the genome of the serotype M12 strain cultured from a patient with acute poststreptococcal glomerulonephritis. The data provide new information about the GAS metagenome and will assist studies of pathogenesis, antimicrobial resistance, and population genomics.


Conflict of interest statement

Competing Interests: The authors have declared that no competing interests exist.

Figures

Figure 1
Figure 1. Genome circular atlases.
(A) MGAS10270, (B) MGAS10750, (C) MGAS2096, and (D) MGAS9429. Data from outermost to innermost circles are in the following order. Genome size in mega base pairs (circle 1). Annotated coding sequences on the forward (circle 2) and reverse strands (circle 3) are in dark and light blue, respectively. Reference landmarks (circle 4) illustrated are: ribosomal RNAs in green, FCT region in gold, transposons in purple, prophages in red, ICEs in royal blue, and Mga regulon region in brown. Comparison of gene content to the 11 other sequenced GAS strains (circle 5) is given as a gradient of nucleotide sequence similarity from low in blue to high in red. CDS percent G+C content (circle 6) with greater than and less than average in red and blue, respectively. Net divergence of CDS dinucleotide composition (circle 7) from the average is in orange. Codon adaptation index, that is codon use consistent with that of highly expressed genes (circle 8) with greater than and less than average in red and green, respectively. Additionally for the two serotype M12 strains a comparison of gene content relative to each other (circle 9) is given as a gradient of nucleotide sequence similarity from low in blue to high in red.
Figure 2
Figure 2. Aligned GAS genomes.
Illustrated are linear diagrams of the four newly determined GAS genome sequences and regions of conserved gene content in pair-wise comparisons. Shown for each genome diagram in green are the six rRNA operons, in red are prophages, and in blue are ICEs. Whole-genome comparisons were made using BLASTN (www.webact.org, e = 1×10⁻⁴, word size = 18 nt) and the graphic depictions of the alignments were made using the Artemis Comparison Tool (www.sanger.ac.uk/Software/ACT/). Regions of conserved syntenic gene content are indicated by blocks of salmon linking the stacked genome diagrams. Nearly all regions of discontinuity in the genome alignments are attributable to exogenous genetic elements.
Figure 3
Figure 3. GAS metagenome exogenous elements.
Illustrated are loci of integration of phages and ICEs into the core chromosome. Prophages are indicated with triangles and ICEs with squares. Stacked triangles and squares indicate a common integration site. Elements are color-coded to indicate the source strain. Prophages and ICEs are numbered as they occur clockwise around the core chromosome for each strain. Integration loci are lettered alphabetically as they occur clockwise around the core chromosome. The six rRNA operons are shown as green bars. Gene designations are as follows: 1) secreted pyrogenic-toxin-superantigens: speA, speC, speH, speI, speK, speL, speM, and ssa; 2) secreted DNAses: sda, sdn, spd1, spd3, and spd4; 3) secreted phospholipase: sla; 4) antimicrobial resistance: erm(A), mef(A), and tet(O); 5) cell surface adhesins: R6 and R28; 6) none, these elements lack a known or obvious virulence gene.
Figure 4
Figure 4. ICEs encoding antimicrobial resistance genes.
(A) 2096-RD.2 encoding Tet(O). (B) 10750-RD.2 encoding Erm(A). Illustrated are predicted coding sequences with gene numbers and predicted functions. Gene numbers given in red denote unique gene content as determined by BLASTP comparison to the GAS metagenome (no hit at e = 1×10⁻⁶). CDS are color coded to designate functionally related groups: red, antimicrobial resistance; green, secreted and cell surface; blue, mobilization and transfer; violet, element maintenance; yellow, transcriptional regulation; grey, hypothetical and unclassified.
Figure 5
Figure 5. Domain architecture of putative cell surface acidic protein MGAS2096_Spy1156.
The protein has a conventional Gram-positive secretion signal sequence and a tripartite (TPKTG, membrane span, positively charged anchor) cell wall attachment domain. The aminoterminal portion of the protein has an intimin/invasin-like domain (Structural Classification of Proteins superfamily: SSF49373) and shares similarity (45% from amino acid ∼50-to-350) with a putative cell surface protein of unknown function (lmo1115) in the genome sequence of the intracellular pathogen Listeria monocytogenes strain EGD-e. The carboxyterminal portion of the protein (∼315-to-1350) has 8 Cna B-type domain repeats (Protein Family: PF05738) and shares similarity with multiple proteins annotated as collagen-binding. These characteristics suggest this protein may function as an adhesin/invasin.
Figure 6
Figure 6. GAS metagenome FCT region variants.
(A) Architecture of the FCT region variants. CDSs are colored to designate the following groups: black, conserved flanking genes (SF370: 5′ Spy_0123 and 3′ Spy_0136); yellow, transcriptional regulators; red, extracellular matrix-binding and/or pilin-subunit proteins; tan, signal peptidases; green, sortases; purple, insertion sequences. Although there are differences both intra- and interserotype indicative of antigenic variation, nearly all of the extracellular matrix-binding proteins and pilin-subunit proteins have predicted secretion signal sequences and cell wall attachment domains in one or more of the genomes. Additionally illustrated is the similarity between the serotype M2 and GBS pilus encoding region proteins in global alignments. (B) Relationships among the FCT region variants. Nucleotide sequences bounded by the flanking conserved genes for the each of the sequenced GAS strains and the five GBS genes in panel A, were aligned with ClustalW and a neighbor-network was generated using SplitsTree.

Similar articles

Cited by

References

    1. Fitzgerald JR, Musser JM. Evolutionary genomics of pathogenic bacteria. Trends Microbiol. 2001;9:547–553. - PubMed
    1. Fleischmann RD, Alland D, Eisen JA, Carpenter L, White O, et al. Whole-genome comparison of Mycobacterium tuberculosis clinical and laboratory strains. J Bacteriol. 2002;184:5479–5490. - PMC - PubMed
    1. Glaser P, Rusniok C, Buchrieser C, Chevalier F, Frangeul L, et al. Genome sequence of Streptococcus agalactiae, a pathogen causing invasive neonatal disease. Mol Microbiol. 2002;45:1499–1513. - PubMed
    1. Holden MT, Feil EJ, Lindsay JA, Peacock SJ, Day NP, et al. Complete genomes of two clinical Staphylococcus aureus strains: evidence for the rapid evolution of virulence and drug resistance. Proc Natl Acad Sci U S A. 2004;101:9786–9791. - PMC - PubMed
    1. Lindsay JA, Holden MT. Staphylococcus aureus: superbug, super genome? Trends Microbiol. 2004;12:378–385. - PubMed

Publication types