

Detection of a microRNA signal in an in vivo expression set of mRNAs
- PMID: 17726534
- PMCID: PMC1950084
- DOI: 10.1371/journal.pone.0000804
Detection of a microRNA signal in an in vivo expression set of mRNAs
Abstract
Background: microRNAs (miRNAs) are approximately 21 nucleotide non-coding transcripts capable of regulating gene expression. The most widely studied mechanism of regulation involves binding of a miRNA to the target mRNA. As a result, translation of the target mRNA is inhibited and the mRNA may be destabilized. The inhibitory effects of miRNAs have been linked to diverse cellular processes including malignant proliferation, apoptosis, development, differentiation, and metabolic processes. We asked whether endogenous fluctuations in a set of mRNA and miRNA profiles contain correlated changes that are statistically distinguishable from the many other fluctuations in the data set.
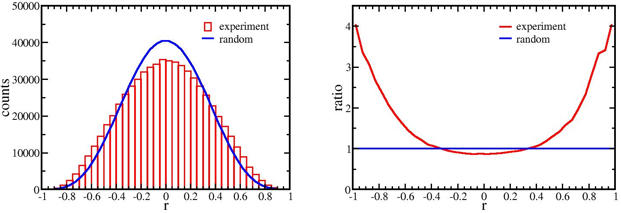
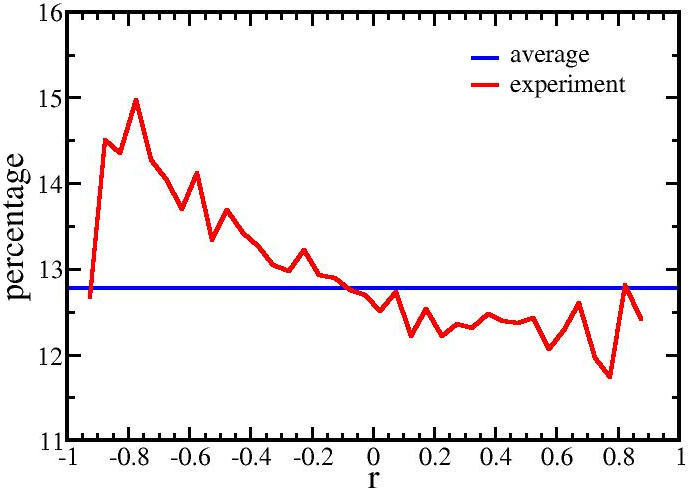
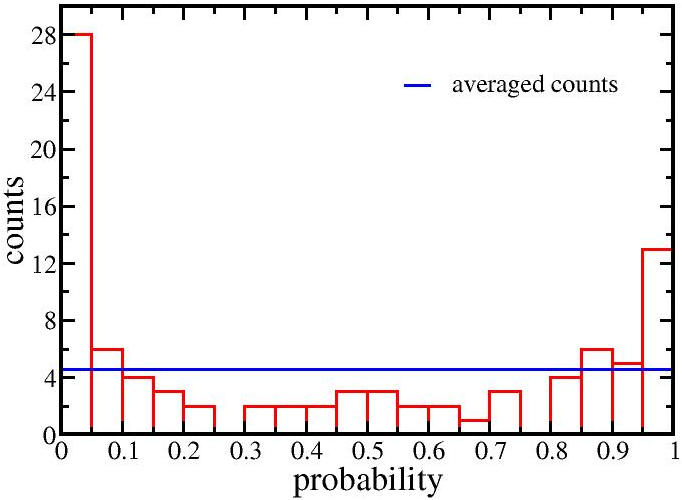
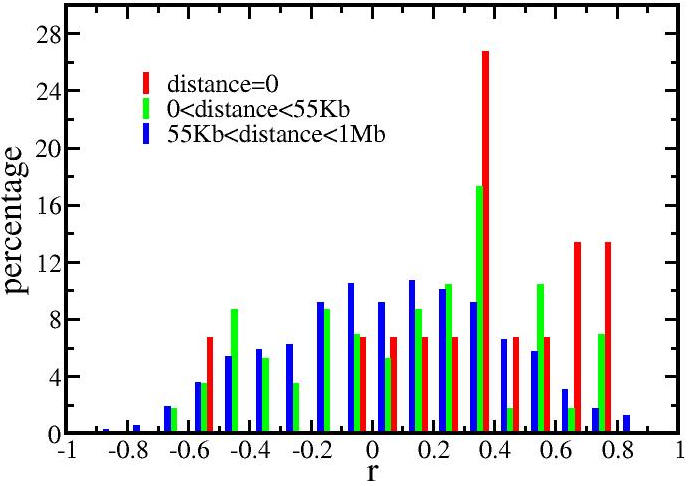
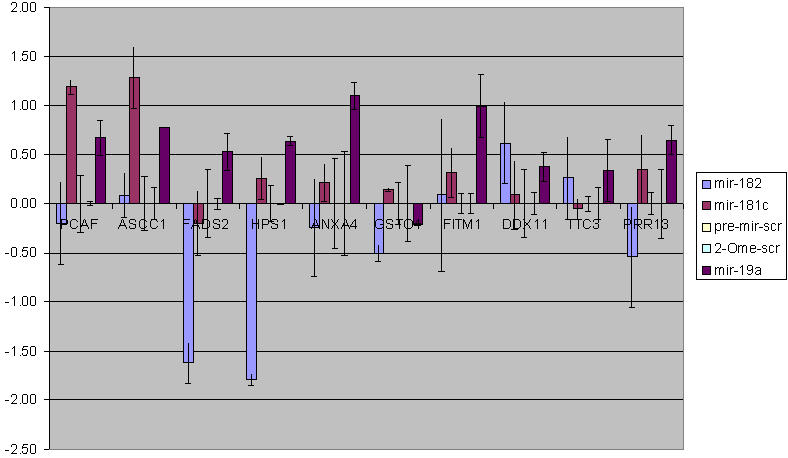
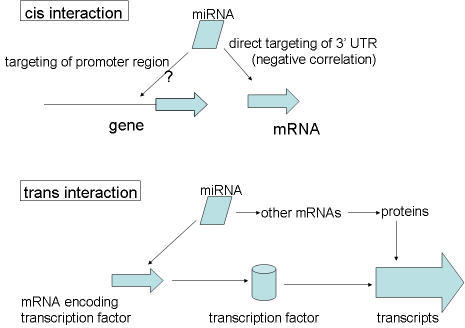
Methodology/principal findings: RNA was extracted from 12 human primary brain tumor biopsies. These samples were used to determine genome-wide mRNA expression levels by microarray analysis and a miRNA profile by real-time reverse transcription PCR. Correlation coefficients were determined for all possible mRNA-miRNA pairs and the distribution of these correlations compared to the random distribution. An excess of high positive and negative correlation pairs were observed at the tails of these distributions. Most of these highest correlation pairs do not contain sufficiently complementary sequences to predict a target relationship; nor do they lie in physical proximity to each other. However, by examining pairs in which the significance of the correlation coefficients is modestly relaxed, negative correlations do tend to predict targets and positive correlations tend to predict physically proximate pairs. A subset of high correlation pairs were experimentally validated by over-expressing or suppressing a miRNA and measuring the correlated mRNAs.
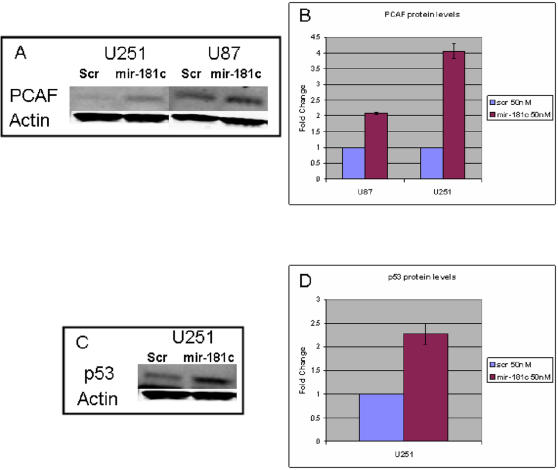
Conclusions/significance: Sufficient information exists within a set of tumor samples to detect endogenous correlations between miRNA and mRNA levels. Based on the validations the causal arrow for these correlations is likely to be directed from the miRNAs to the mRNAs. From these data sets, we inferred and validated a tumor suppression pathway linked to miR-181c.
Conflict of interest statement
Figures


Similar articles
-
Correlation of expression profiles between microRNAs and mRNA targets using NCI-60 data.BMC Genomics. 2009 May 12;10:218. doi: 10.1186/1471-2164-10-218. BMC Genomics. 2009. PMID: 19435500 Free PMC article.
-
Genome-wide transcriptional profiling reveals microRNA-correlated genes and biological processes in human lymphoblastoid cell lines.PLoS One. 2009 Jun 11;4(6):e5878. doi: 10.1371/journal.pone.0005878. PLoS One. 2009. PMID: 19517021 Free PMC article.
-
Dissecting the biological relationship between TCGA miRNA and mRNA sequencing data using MMiRNA-Viewer.BMC Bioinformatics. 2016 Oct 6;17(Suppl 13):336. doi: 10.1186/s12859-016-1219-y. BMC Bioinformatics. 2016. PMID: 27766936 Free PMC article.
-
MicroRNA profiling in mucosal biopsies of eosinophilic esophagitis patients pre and post treatment with steroids and relationship with mRNA targets.PLoS One. 2012;7(7):e40676. doi: 10.1371/journal.pone.0040676. Epub 2012 Jul 16. PLoS One. 2012. PMID: 22815788 Free PMC article.
-
Prediction of human microRNA targets.Methods Mol Biol. 2006;342:101-13. doi: 10.1385/1-59745-123-1:101. Methods Mol Biol. 2006. PMID: 16957370 Review.
Cited by
-
TGF-β and BMP signaling are associated with the transformation of glioblastoma to gliosarcoma and then osteosarcoma.Neurooncol Adv. 2023 Dec 19;6(1):vdad164. doi: 10.1093/noajnl/vdad164. eCollection 2024 Jan-Dec. Neurooncol Adv. 2023. PMID: 38292240 Free PMC article.
-
MiRNA as potential biomarkers and therapeutic targets for gastric cancer.World J Gastroenterol. 2014 Aug 14;20(30):10432-9. doi: 10.3748/wjg.v20.i30.10432. World J Gastroenterol. 2014. PMID: 25132759 Free PMC article. Review.
-
NeMo: Network Module identification in Cytoscape.BMC Bioinformatics. 2010 Jan 18;11 Suppl 1(Suppl 1):S61. doi: 10.1186/1471-2105-11-S1-S61. BMC Bioinformatics. 2010. PMID: 20122237 Free PMC article.
-
FCGR2B as a prognostic and immune microenvironmental marker for gliomas based on transcriptomic analysis.Medicine (Baltimore). 2023 Sep 15;102(37):e35084. doi: 10.1097/MD.0000000000035084. Medicine (Baltimore). 2023. PMID: 37713871 Free PMC article.
-
Multilevel omic data integration in cancer cell lines: advanced annotation and emergent properties.BMC Syst Biol. 2013 Feb 19;7:14. doi: 10.1186/1752-0509-7-14. BMC Syst Biol. 2013. PMID: 23418673 Free PMC article.
References
-
- Nilsen TW. Mechanisms of microRNA-mediated gene regulation in animal cells. Trends Genet. 2007 - PubMed
-
- Lu J, Getz G, Miska EA, Alvarez-Saavedra E, Lamb J, et al. MicroRNA expression profiles classify human cancers. Nature. 2005;435:834–838. - PubMed
-
- Nutt CL, Mani DR, Betensky RA, Tamayo P, Cairncross JG, et al. Gene expression-based classification of malignant gliomas correlates better with survival than histological classification. Cancer Res. 2003;63:1602–1607. - PubMed
-
- Pomeroy SL, Tamayo P, Gaasenbeek M, Sturla LM, Angelo M, et al. Prediction of central nervous system embryonal tumour outcome based on gene expression. Nature. 2002;415:436–442. - PubMed
-
- Lao K, Xu NL, Sun YA, Livak KJ, Straus NA. Real time PCR profiling of 330 human mircoRNAs. Biotechnol J. 2007;2:33–35. - PubMed
Publication types
MeSH terms
Substances
Grants and funding
LinkOut - more resources
Full Text Sources
Other Literature Sources
Molecular Biology Databases
Research Materials
