. 2007 Aug 29;2(8):e806.
doi: 10.1371/journal.pone.0000806.

Primary role of functional ischemia, quantitative evidence for the two-hit mechanism, and phosphodiesterase-5 inhibitor therapy in mouse muscular dystrophy

Affiliations

Primary role of functional ischemia, quantitative evidence for the two-hit mechanism, and phosphodiesterase-5 inhibitor therapy in mouse muscular dystrophy

Akihiro Asai et al. PLoS One. .

Abstract

Background: Duchenne Muscular Dystrophy (DMD) is characterized by increased muscle damage and an abnormal blood flow after muscle contraction: the state of functional ischemia. Until now, however, the cause-effect relationship between the pathogenesis of DMD and functional ischemia was unclear. We examined (i) whether functional ischemia is necessary to cause contraction-induced myofiber damage and (ii) whether functional ischemia alone is sufficient to induce the damage.

Methodology/principal findings: In vivo microscopy was used to document assays developed to measure intramuscular red blood cell flux, to quantify the amount of vasodilatory molecules produced from myofibers, and to determine the extent of myofiber damage. Reversal of functional ischemia via pharmacological manipulation prevented contraction-induced myofiber damage in mdx mice, the murine equivalent of DMD. This result indicates that functional ischemia is required for, and thus an essential cause of, muscle damage in mdx mice. Next, to determine whether functional ischemia alone is enough to explain the disease, the extent of ischemia and the amount of myofiber damage were compared both in control and mdx mice. In control mice, functional ischemia alone was found insufficient to cause a similar degree of myofiber damage observed in mdx mice. Additional mechanisms are likely contributing to cause more severe myofiber damage in mdx mice, suggestive of the existence of a "two-hit" mechanism in the pathogenesis of this disease.

Conclusions/significance: Evidence was provided supporting the essential role of functional ischemia in contraction-induced myofiber damage in mdx mice. Furthermore, the first quantitative evidence for the "two-hit" mechanism in this disease was documented. Significantly, the vasoactive drug tadalafil, a phosphodiesterase 5 inhibitor, administered to mdx mice ameliorated muscle damage.


Conflict of interest statement

Competing Interests: The authors have declared that no competing interests exist.

Figures

Figure 1
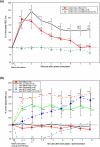
Figure 1. Local RBC flux is increased in the post-contraction muscle of control but not of mdx mice.
Using in vivo video-microscopy, the numbers of RBC passing by through the primary arterioles (1st order) in control (a) and mdx (b) mice were counted and plotted against time (minutes) after a tetanic stimulation (50Hz). The y-axis represents the percent increase in the RBC number from the basal (100%) RBC flux. (a) In response to the direct tetanic stimulation on the muscles of control mice, arterioles both at junctional (NMJ, closed square, red solid line), and extrajunctional (non-NMJ, open circle, black solid line) areas showed a transient increase in the RBC. The contralateral side of the control mice (closed triangle, dash-dotted line) did not show any increase in the RBC flux, suggesting that the increase in RBC flux is the specific effect of contraction. (b) The response in RBC flux was completely absent in mdx mice (NMJ: closed square, red solid line, and non-NMJ: open circle, black solid line). RBC flux was increased in mdx mice by a local administration of SNAP (open square, red dash-dotted line), clenbuterol (closed diamond and greed solid line), or 8-CPT cGMP (closed diamond and blue dash-dotted line). Addition of 1 µg/ml of angiotensin-II (ATII) inhibited the 8-CPT cGMP-induced increase in RBC flux (open diamond, blue dash-dotted line). Addition of ATII transiently dropped the RBC flux below 50% of the basal level and the values (1.1% for 1min and 17.4% for 2 min) are indicated as numbers adjacent to each point. Unless otherwise specified, measurements were performed on arterioles in non-NMJ areas. ** and ***: Statistically significant difference from contralateral side in control mice (a) or from mdx mice without any treatment (b) by ANOVA (p<0.01, p<0.001, respectively). n.s. Not significantly different from contralateral side by ANOVA (a). # and ##: Statistically significant difference (p<0.05 and 0.01) between NMJ and non-NMJ by Student-t test (a). Standard errors are shown as bars at each time point. The number of individual animals in each group is indicated in the parenthesis.
Figure 2
Figure 2. In vivo microscopic measurement of muscle production of NO and H2O2 in control and mdx mice after tetanic stimulation.
(a) In vivo microscopic views of fluorescent signal (100×) are presented with pseudocolors added according to the fluorescent intensity of the signals (a). Warmer colors correspond to higher intensity (note scale bar on right side). NO or H2O2 produced by stimulated myofibers reacts with DAF-FM (left column) or H2-DCFDA (right column) respectively, and releases a fluorescence signal. The longitudinal area between the two black arrows in the microscopic image corresponds to an individual myofiber (row1, Cont, no Stim). Myofibers in the control muscles produce a prominent amount of NO (left) and H2O2 (right) in response to tetanic stimuli (50Hz), shown as Cont, Tet (row 2). The spot-like staining showed an increased production of NO in response to muscle contraction (“Cont, Tet” in the left column, examples pointed by a black arrow head), but were not prominent with H2O2 signal (right column). A non-specific NOS inhibitor L-NAME (row3, left), or combination of EDHF inhibitors apamin and charybdotoxin (row 3, right), perturbed production of NO or H2O2, respectively, after tetanic stimulation (Cont, Tet+Inhibitors). Although the basal level of NO production in the mdx muscle is high (row 4, left column, Mdx, no Stim, p = 0.004 by Student-t test), muscles in these mice do not show an increase in the NO (row 5, left) or H2O2 (row 5, right) production in response to muscle contraction (Mdx, Tet). Mdx mice showed greater numbers of spot-like staining for NO (examples pointed by a white arrow head) as compared to control mice, but these spots did not show an increase in intensity after muscle contraction. (b&c) The quantification data of the detected signal of NO (b) and H2O2 (c) in the sternomastoid muscles are shown. Average fluorescence released by myocytes was calculated by densitometry of the captured images from in vivo microscopy on different mice (the numbers of animals in each group indicated in the bottom row). The y-axis represents the percent increase in the arbitrary fluorescence unit per 30 (b) or 60 (c) minutes of observation. **: Statistically significant by ANOVA (P<0.01). n.s.: Not statistically significant. #: Statistically significant between the basal level of control and mdx mice (P<0.05). Error bars show standard error of each value.
Figure 3
Figure 3. In vivo microscopic assay of myofiber damage.
Identical positions of the myofibers were traced by examining the anatomy of the individual myofibers (stained green), and/or the shape and relative location of NMJs (stained red by BTX-Alexa Fluor 594). (a) Intact cells in control mice with no treatment showed a normal striated pattern of staining of M/ER with DiOC6 (Intact myofibers, control mouse#1). (b) Already dead myofibers (killed by electrical ablasion 1 hour before the experiment) are not stained and excluded from the study. (c) When cells are induced to death by combination of severe ischemia (L-NAME, apamin, charybdotoxin, and vascular oppression) and strenuous contraction (12 times repeat of tetanic stimuli), distribution of these DiOC6-stained compartments becomes granular (arrow heads) or bulged (arrows), or exhibit a rippled pattern (asterisk). Each image is in focus. Cell death identified by abnormal DiOC6 labeling was confirmed by dye-exclusion staining with short exposure to Hoechst33258 (blue color at endpoint in each group). The black scale bar in the figure represents 10 µm.
Figure 4
Figure 4. Replenishing NO prevents contraction-induced myofiber cell death.
Mdx mice (open circle and black solid line, N = 6) showed progressive increase of damaged loci over the time course of 6 hours after a 6 times repeat of the tetanic stimuli (X-axis: time after tetanic contraction. Y-axis: damaged myofiber loci counted throughout the entire tissue). For quantification of myofiber damage, the numbers of damaged sites (loci) were counted instead of numbers of the damaged fibers, because there are various types and different locus onset of damage along the length of a myofiber (see Methods for detail). Administration of SNAP (NO donor, 100 µM) prevented the mdx mice fibers from undergoing contraction-induced damage (open square and red dash-dotted line, N = 5). In the groups where 8-CPT-cGMP (“cGMP”, 500 µM, closed diamond and blue dash-dotted line, N = 5), clenbuterol (“Clen”, 0.05 mg/ml, closed diamond and green solid line, N = 4), or tadalafil (“Tada”, 4 mg/kgBW, cross and orange solid line, N = 5) was given during muscle contraction, the increase in myofiber damage was abolished. Addition of 1 µg/ml of angiotensin-II (ATII) inhibited the myofiber protective effect by 8-CPT-cGMP (open diamond and blue dash-dotted line, N = 6). ATII alone did not cause myofiber damage (open diamond and blue dotted line, N = 4). Control mice with (closed triangle and blue solid line, N = 4) or without (open triangle and pink solid line, N = 6) SNAP administration did not show increase in myofiber damage. Statistical differences are indicated between mdx without drug treatment (black open circle) and all other groups except for 8-CPT cGMP plus ATII (**: p<0.01, ***:p<0.001), or all other groups except for 8-CPT cGMP or 8-CPT cGMP plus ATII (++: p<0.01) by ANOVA. There was a statistically significant difference between groups with 8-CPT cGMP and with 8-CPT cGMP plus ATII (#: p<0.05, ##: p<0.01) by Student-t test. There was no significant difference between groups without any treatment (black open circle) and with 8-CPT cGMP plus ATII (blue open diamond) at any time point. Error bars in the graph are the standard errors to each value. All the drugs are removed and tissues are washed after muscle contraction. N refers to the number of animals used for each treatment.
Figure 5
Figure 5. Severe ischemia induced by pharmacological interventions results in myofiber damage in control mouse receiving repeated tetanic stimulation.
Numbers of damaged myofiber loci (y-axis) were counted throughout the entire tissue using in vivo microscopy and plotted against time after tetanic contraction (x-axis). For quantification of myofiber damage, the numbers of damaged sites (loci) were counted instead of numbers of the damaged fibers, because there are different types of damage observed along the length of a myofiber (see Methods for detail). When ischemia stress was provided by applying L-NAME, apamin plus charybdotoxin (ChTx), and vascular oppression, control mice showed progressive increase in the amount of muscle damage (closed diamond and black solid line) under the application of increased stimuli (12 times). However, when L-NAME (open square and red dotted line), apamin plus charybdotoxin (closed triangle and blue solid line), or vascular oppression (open diamond and orange dotted line) was lacking, a comparable amount of myofiber injury was not achieved. Even when all reagents were present, the amount of myofiber damage was minimal without tetanic contraction (closed square and pink solid line). Tetanic stimulation and vascular oppression alone did not cause significant myofiber destruction (open circle and green dotted line). Six times stimuli applied in control mice (X mark and blue dash-dotted line) did not induce an equivalent amount of myofiber damage as compared to 12 times control (black diamond) or to 6 times mdx mice (Figure 4, open black circle). N = 5 mice for each treatment. *:p<0.05, **:p<0.01, by ANOVA. Standard errors are shown as bars added to each point.
Figure 6
Figure 6. Comparison of total RBC flux increase in control and mdx mice in response to tetanic stimulation and pharmacological agents.
Total RBC flux increase was calculated as an integral of % change in RBC flux after stimulation. Tetanic stimulation increased the flux to 653.2 (%×min, far left column) in control mice. Administration of L-NAME (2nd column), apamin plus charybdotoxin (3rd), or vascular oppression (5th) suppressed the increase in RBC flux. When all the above treatments were combined, RBC flux was further suppressed (6th). The level of ischemia in the control mice receiving all the combination (6th) was more severe as compared to mdx mice (far right). N = 8 mice, for each treatment. * and **: Statistically significant difference from all other treatments (p<0.05 and 0.01, ANOVA). ##: Statistically significant difference between the two groups (p<0.01, t-test). Standard error bars are added to the histogram.
Figure 7
Figure 7. Evans Blue staining of the damaged fibers in the hindlimb and the diaphragm muscles of mdx mice (4 weeks old).
(a&b) Six hours after the injection of Evans Blue dye, the extent of myofiber damage as indicated by blue staining was observed in the superficial hindlimb muscles (a) and the diaphragm (b). Three mice from each group are shown (a and b). Compare lateral and medial views of the stained fibers (arrows) in mice without (−) and with (+) tadalafil treatment (a). Mice without tadalafil treatment (−) show extensive blue staining (arrows in a and b). Tadalafil treatment (+) ameliorated the damage in the same muscle tissues, although it did not completely suppress the myofiber damage in some mdx mice. (c) Gastrocnemius, gluteus maximus, quadriceps, and diaphragm muscles were harvested and cryosectioned for fluorescence microscopic observation. In the non-treated group (Mdx#1 and #2 in c), all the muscles studied showed increased numbers of damaged myofibers stained by the injected dye (high fluorescence signals are shown in white). Tadalafil treatment reduced the numbers of damaged myofibers (Mdx#3 and #4 in c). The white scale bar at the bottom of images represents 100 µm for gastrocnemius, gluteus, and quadriceps, and 50 µm for diaphragm. (d) The number of positively stained damaged myofibers (in c) were counted and shown as bar graphs for the entire gastrocnemius, gluteus, and quadriceps muscles. For diaphragm muscles, the positively stained myofibers are shown as percentage of the total fiber count. Mdx mice without treatment (N = 10, white columns) showed extensive amount of myofiber damage. Tadalafil treatment (N = 8, columns shaded with hatched lines) showed a statistically significant decrease in the amount of damaged myofibers in gastrocnemius, gluteus maximus, and quadriceps muscles. *: p<0.05, **<p<0.01 by t-test. N refers to the number of animals used for each treatment.
Figure 8
Figure 8. Evaluation of the efficacy of tadalafil by conventional histology.
(a) Two images from different animals in tadalafil-treated and non-treated groups are presented for trichrome staining of gastrocnemius muscles (left panels): Ectopic fibrosis in extensively damaged areas was observed in the non-treated group (−) (yellow arrows). In the treatment group (+), there are still damaged fibers and ectopic fibrosis observed, but not to the level seen in the non-treated group. In H&E staining of gastrocnemius muscles (right panels), non-treated mdx mice showed many basophilic (purple) small cells reminiscent of infiltrating cells, proliferating fibroblasts/myoblasts, and tadalafil-treated group showed less. Myofibers with central nuclei, suggestive of regenerating fibers, are basophilic and prominent in the non-treated group, but were also observed in the treated group. Heterogeneity of fiber size was more prominent in the non-treated group. Yellow diamond arrows with “C” point to myofibers with central nuclei. Black scale bars on each micrograph image represent 50 µm. (b) The area size for ectopic fibrosis with blue staining was calculated in pixel size (n = 6 and 5 for non-treatment and tadalafil treatment groups). Tadalafil significantly reduced the amount of fibrosis in gastrocnemius (GC), gluteus (Glut), quadriceps (Quad), and diaphragm (Diaph) muscles (*: p<0.05 by t-test). (c) The percentage of myofibers with central nuclei is shown in a histogram. Tadalafil treatment reduced the percentage of central nuclei (*:p<0.05, **:p<0.01 by t-test) (d) The variation in fiber size in gastrocnemius muscles was quantified and shown as percentage fiber distribution. In non-treated mdx mice, the fiber size was uneven ranging from small (<300 µm2) to large (>2800 µm2) cross sectional area. Tadalafil treatment reduced the variation by lowering the percentage of small myofibers (*: p<0.05 by t-test)

References

    1. Hoffman EP, Kunkel LM. Dystrophin abnormalities in Duchenne/Becker muscular dystrophy. Neuron. 1989;2:1019–1029. - PubMed
    1. Emery AE. Population frequencies of inherited neuromuscular diseases–a world survey. Neuromuscul Disord. 1991;1:19–29. - PubMed
    1. Petrof BJ. The molecular basis of activity-induced muscle injury in Duchenne muscular dystrophy. Mol Cell Biochem. 1998;179:111–123. - PubMed
    1. Sander M, Chavoshan B, Harris SA, Iannaccone ST, Stull JT, et al. Functional muscle ischemia in neuronal nitric oxide synthase-deficient skeletal muscle of children with Duchenne muscular dystrophy. Proc Natl Acad Sci U S A. 2000;97:13818–13823. - PMC - PubMed
    1. Thomas GD, Sander M, Lau KS, Huang PL, Stull JT, et al. Impaired metabolic modulation of alpha-adrenergic vasoconstriction in dystrophin-deficient skeletal muscle. Proc Natl Acad Sci U S A. 1998;95:15090–15095. - PMC - PubMed

Publication types

MeSH terms