

Insulin resistance and body fat distribution in South Asian men compared to Caucasian men
- PMID: 17726542
- PMCID: PMC1950568
- DOI: 10.1371/journal.pone.0000812
Insulin resistance and body fat distribution in South Asian men compared to Caucasian men
Abstract
Objective: South Asians are susceptible to insulin resistance even without obesity. We examined the characteristics of body fat content, distribution and function in South Asian men and their relationships to insulin resistance compared to Caucasians.
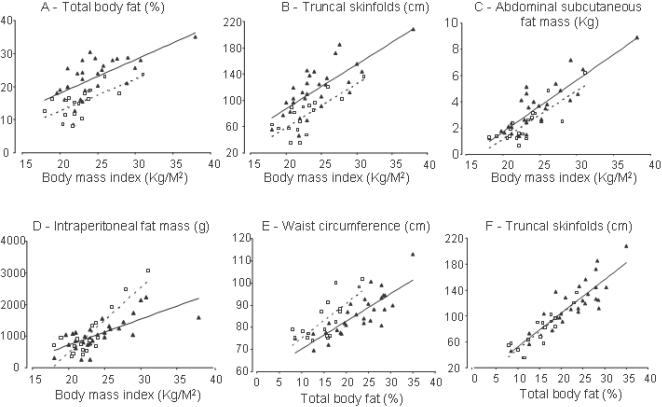
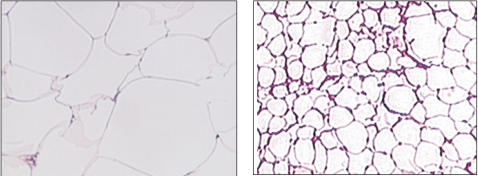
Research design and methods: Twenty-nine South Asian and 18 Caucasian non-diabetic men (age 27+/-3 and 27+/-3 years, respectively) underwent euglycemic-hyperinsulinemic clamp for insulin sensitivity, underwater weighing for total body fat, MRI of entire abdomen for intraperitoneal (IP) and subcutaneous abdominal (SA) fat and biopsy of SA fat for adipocyte size.
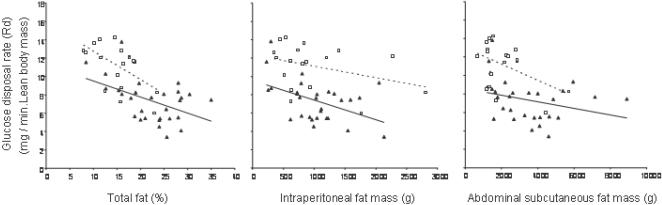
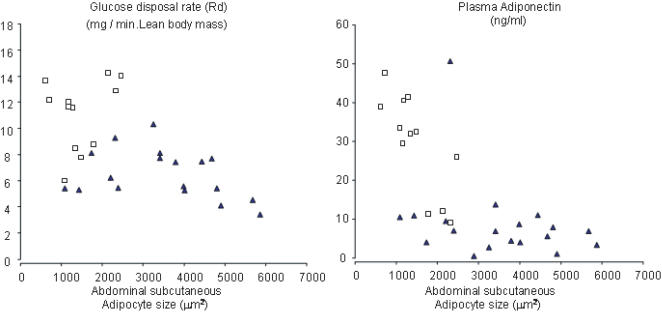
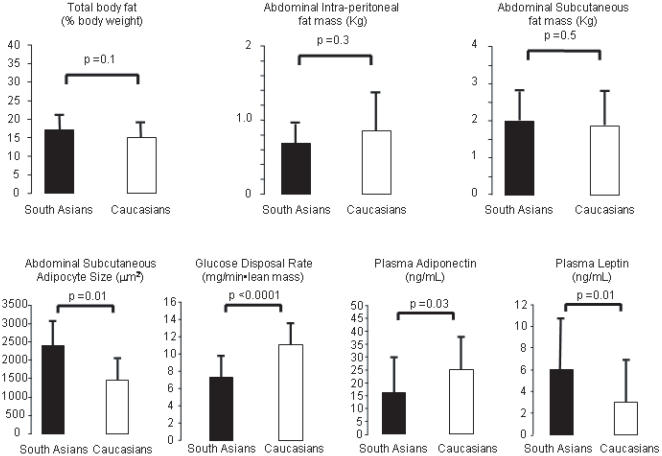
Results: Compared to Caucasians, in spite of similar BMI, South Asians had higher total body fat (22+/-6 and 15+/-4% of body weight; p-value<0.0001), higher SA fat (3.5+/-1.9 and 2.2+/-1.3 kg, respectively; p-value = 0.004), but no differences in IP fat (1.0+/-0.5 and 1.0+/-0.7 kg, respectively; p-value = 0.4). SA adipocyte cell size was significantly higher in South Asians (3491+/-1393 and 1648+/-864 microm2; p-value = 0.0001) and was inversely correlated with both glucose disposal rate (r-value = -0.57; p-value = 0.0008) and plasma adiponectin concentrations (r-value = -0.71; p-value<0.0001). Adipocyte size differences persisted even when SA was matched between South Asians and Caucasians.
Conclusions: Insulin resistance in young South Asian men can be observed even without increase in IP fat mass and is related to large SA adipocytes size. Hence ethnic excess in insulin resistance in South Asians appears to be related more to excess truncal fat and dysfunctional adipose tissue than to excess visceral fat.
Conflict of interest statement
Figures
References
-
- Abate N, Chandalia M. The impact of ethnicity on type 2 diabetes. J Diabetes Complications. 2003;17(1):39–58. - PubMed
-
- McKeigue PM, Shah B, Marmot MG. Relation of central obesity and insulin resistance with high diabetes prevalence and cardiovascular risk in South Asians. Lancet. 1991;337(8738):382–6. - PubMed
-
- Chandalia M, Abate N, Garg A, Stray-Gundersen J, Grundy SM. Relationship between generalized and upper body obesity to insulin resistance in Asian Indian men. J Clin Endocrinol Metab. 1999;84:2329–35. - PubMed
-
- McKeigue PM, Pierpoint T, Ferrie JE, Marmot MG. Relationship of glucose intolerance and hyperinsulinaemia to body fat pattern in south Asians and Europeans. Diabetologia. 1992;35(8):785–91. - PubMed
-
- Abate N, Carulli L, Cabo-Chan A, Jr, Chandalia M, Snell PG, Grundy SM. Genetic polymorphism PC-1 K121Q and ethnic susceptibility to insulin resistance. J Clin Endocrinol Metab. 2003;88(12):5927–34. - PubMed
Publication types
MeSH terms
Substances
Grants and funding
LinkOut - more resources
Full Text Sources
