

Distinguishing functional amino acid covariation from background linkage disequilibrium in HIV protease and reverse transcriptase
- PMID: 17726544
- PMCID: PMC1950573
- DOI: 10.1371/journal.pone.0000814
Distinguishing functional amino acid covariation from background linkage disequilibrium in HIV protease and reverse transcriptase
Abstract
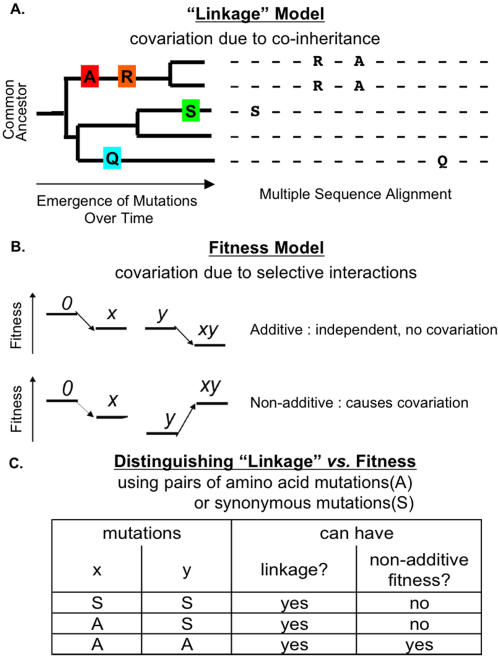
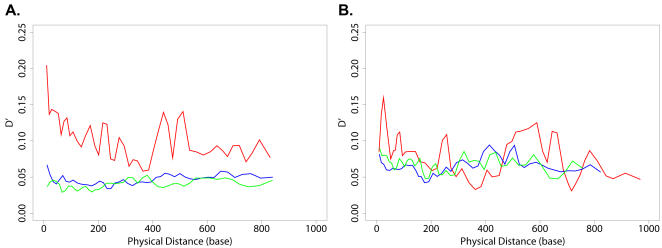
Correlated amino acid mutation analysis has been widely used to infer functional interactions between different sites in a protein. However, this analysis can be confounded by important phylogenetic effects broadly classifiable as background linkage disequilibrium (BLD). We have systematically separated the covariation induced by selective interactions between amino acids from background LD, using synonymous (S) vs. amino acid (A) mutations. Covariation between two amino acid mutations, (A,A), can be affected by selective interactions between amino acids, whereas covariation within (A,S) pairs or (S,S) pairs cannot. Our analysis of the pol gene--including the protease and the reverse transcriptase genes--in HIV reveals that (A,A) covariation levels are enormously higher than for either (A,S) or (S,S), and thus cannot be attributed to phylogenetic effects. The magnitude of these effects suggests that a large portion of (A,A) covariation in the HIV pol gene results from selective interactions. Inspection of the most prominent (A,A) interactions in the HIV pol gene showed that they are known sites of independently identified drug resistance mutations, and physically cluster around the drug binding site. Moreover, the specific set of (A,A) interaction pairs was reproducible in different drug treatment studies, and vanished in untreated HIV samples. The (S,S) covariation curves measured a low but detectable level of background LD in HIV.
Conflict of interest statement
Figures


Similar articles
-
HIV-1 subtype B protease and reverse transcriptase amino acid covariation.PLoS Comput Biol. 2007 May;3(5):e87. doi: 10.1371/journal.pcbi.0030087. PLoS Comput Biol. 2007. PMID: 17500586 Free PMC article.
-
Covariation of amino acid positions in HIV-1 protease.Virology. 2003 Sep 30;314(2):536-48. doi: 10.1016/s0042-6822(03)00484-7. Virology. 2003. PMID: 14554082
-
[Genotypic antiretroviral resistance testing and phylogenetic analysis of protease and reverse transcriptase in antiretroviral drug-naïve AIDS patients in Henan province].Zhonghua Liu Xing Bing Xue Za Zhi. 2005 May;26(5):351-5. Zhonghua Liu Xing Bing Xue Za Zhi. 2005. PMID: 16053762 Chinese.
-
Locations of anti-AIDS drug binding sites and resistance mutations in the three-dimensional structure of HIV-1 reverse transcriptase. Implications for mechanisms of drug inhibition and resistance.J Mol Biol. 1994 Oct 28;243(3):369-87. doi: 10.1006/jmbi.1994.1665. J Mol Biol. 1994. PMID: 7525966 Review.
-
Structural mechanisms of HIV drug resistance.Annu Rev Pharmacol Toxicol. 1996;36:545-71. doi: 10.1146/annurev.pa.36.040196.002553. Annu Rev Pharmacol Toxicol. 1996. PMID: 8725401 Review.
Cited by
-
A multifaceted analysis of HIV-1 protease multidrug resistance phenotypes.BMC Bioinformatics. 2011 Dec 15;12:477. doi: 10.1186/1471-2105-12-477. BMC Bioinformatics. 2011. PMID: 22172090 Free PMC article.
-
Deep sequencing of protease inhibitor resistant HIV patient isolates reveals patterns of correlated mutations in Gag and protease.PLoS Comput Biol. 2015 Apr 20;11(4):e1004249. doi: 10.1371/journal.pcbi.1004249. eCollection 2015 Apr. PLoS Comput Biol. 2015. PMID: 25894830 Free PMC article.
-
Synthetic lethals in HIV: ways to avoid drug resistance : Running title: Preventing HIV resistance.Biol Direct. 2015 Apr 17;10:17. doi: 10.1186/s13062-015-0044-y. Biol Direct. 2015. PMID: 25888435 Free PMC article.
-
Correlated evolution of nearby residues in Drosophilid proteins.PLoS Genet. 2011 Feb;7(2):e1001315. doi: 10.1371/journal.pgen.1001315. Epub 2011 Feb 24. PLoS Genet. 2011. PMID: 21383965 Free PMC article.
-
CoVaMa: Co-Variation Mapper for disequilibrium analysis of mutant loci in viral populations using next-generation sequence data.Methods. 2015 Dec;91:40-47. doi: 10.1016/j.ymeth.2015.09.021. Epub 2015 Sep 25. Methods. 2015. PMID: 26408523 Free PMC article.
References
-
- Altschuh D, Lesk AM, Bloomer AC, Klug A. Correlation of co-ordinated amino acid substitutions with function in viruses related to tobacco mosaic virus. J Mol Biol. 1987;193:693–707. - PubMed
-
- Gobel U, Sander C, Schneider R, Valencia A. Correlated mutations and residue contacts in proteins. Proteins. 1994;18:309–317. - PubMed
-
- Shindyalov IN, Kolchanov NA, Sander C. Can three-dimensional contacts in protein structures be predicted by analysis of correlated mutations? Protein Eng. 1994;7:349–358. - PubMed
-
- Thomas DJ, Casari G, Sander C. The prediction of protein contacts from multiple sequence alignments. Protein Eng. 1996;9:941–948. - PubMed
-
- Olmea O, Valencia A. Improving contact predictions by the combination of correlated mutations and other sources of sequence information. Fold Des. 1997;2:S25–32. - PubMed
Publication types
MeSH terms
Substances
Grants and funding
LinkOut - more resources
Full Text Sources
Molecular Biology Databases
Research Materials
