. 2007;8(8):R175.
doi: 10.1186/gb-2007-8-8-r175.

Disruption and pseudoautosomal localization of the major histocompatibility complex in monotremes

Affiliations

Disruption and pseudoautosomal localization of the major histocompatibility complex in monotremes

Juliane C Dohm et al. Genome Biol. 2007.

Abstract

Background: The monotremes, represented by the duck-billed platypus and the echidnas, are the most divergent species within mammals, featuring a flamboyant mix of reptilian, mammalian and specialized characteristics. To understand the evolution of the mammalian major histocompatibility complex (MHC), the analysis of the monotreme genome is vital.

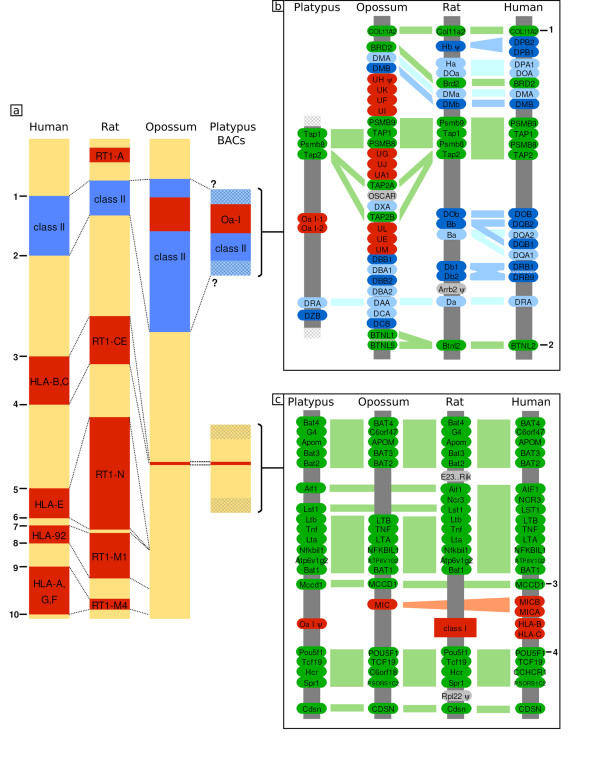
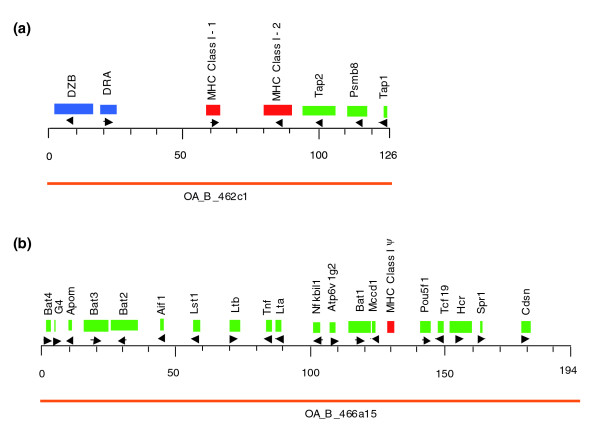
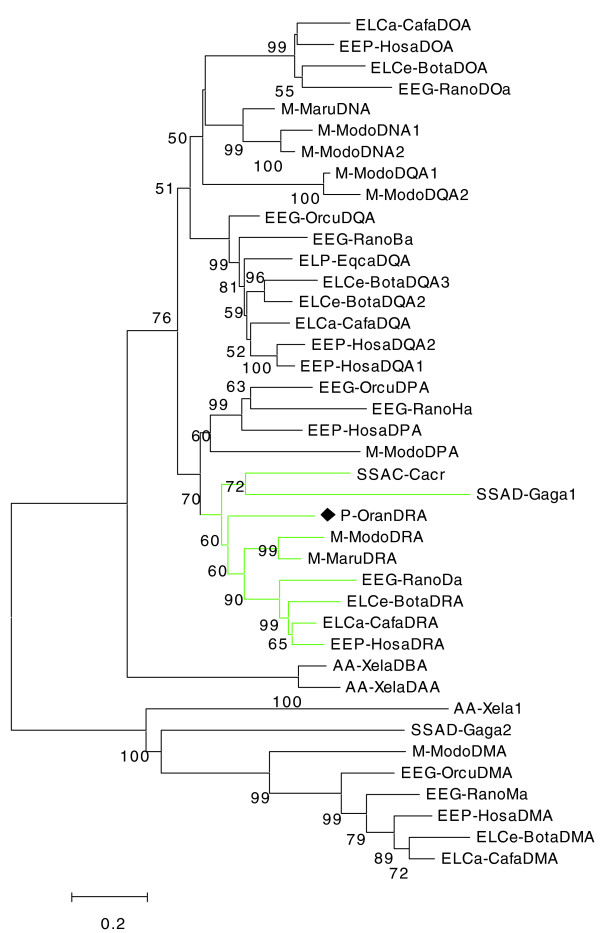
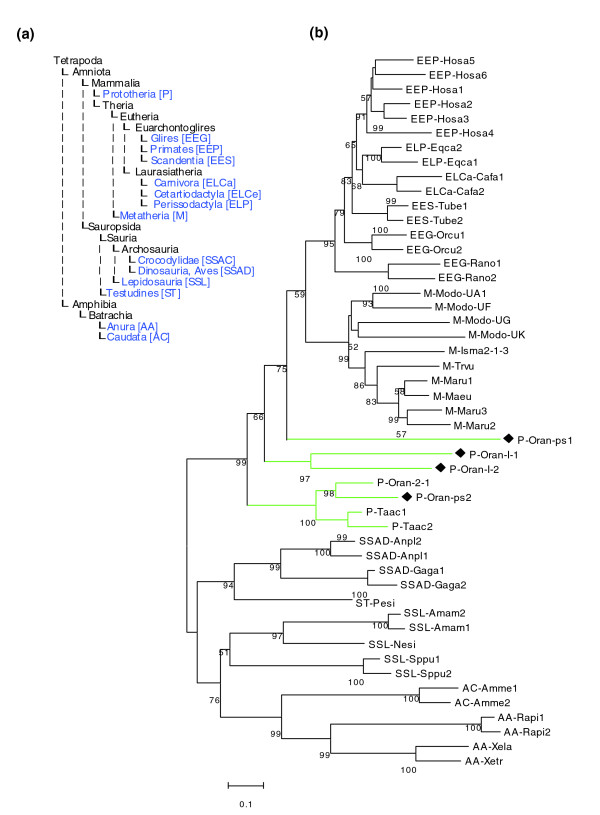
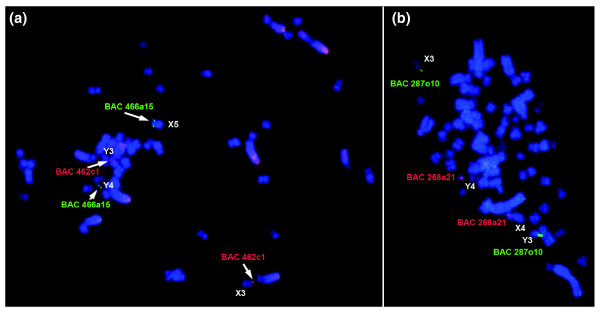
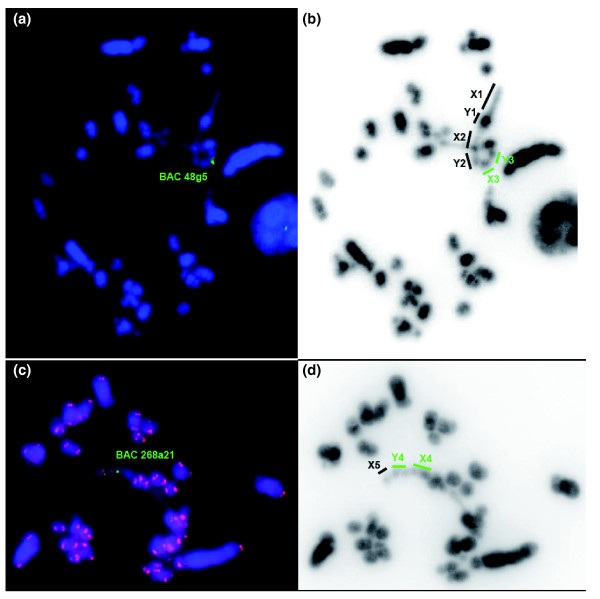
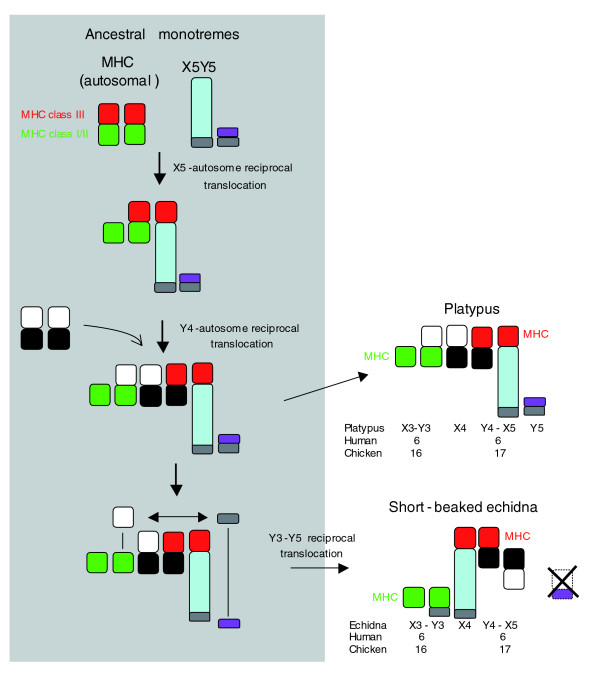
Results: We characterized several MHC containing bacterial artificial chromosome clones from platypus (Ornithorhynchus anatinus) and the short-beaked echidna (Tachyglossus aculeatus) and mapped them onto chromosomes. We discovered that the MHC of monotremes is not contiguous and locates within pseudoautosomal regions of two pairs of their sex chromosomes. The analysis revealed an MHC core region with class I and class II genes on platypus and echidna X3/Y3. Echidna X4/Y4 and platypus Y4/X5 showed synteny to the human distal class III region and beyond. We discovered an intron-containing class I pseudogene on platypus Y4/X5 at a genomic location equivalent to the human HLA-B,C region, suggesting ancestral synteny of the monotreme MHC. Analysis of male meioses from platypus and echidna showed that MHC chromosomes occupy different positions in the meiotic chains of either species.

Conclusion: Molecular and cytogenetic analyses reveal new insights into the evolution of the mammalian MHC and the multiple sex chromosome system of monotremes. In addition, our data establish the first homology link between chicken microchromosomes and the smallest chromosomes in the monotreme karyotype. Our results further suggest that segments of the monotreme MHC that now reside on separate chromosomes must once have been syntenic and that the complex sex chromosome system of monotremes is dynamic and still evolving.


Figures

Figure 1
Figure 1
Comparative map of the mammalian MHC region. (a) Aligned MHC regions of human, rat, opossum [4,5,10] and the sequenced portions of the platypus MHC. Intervals are color-coded: class I regions are shown in red; class II regions in blue; and framework regions including class III in yellow. Circled numbers denote framework genes that typically flank these intervals: 1, Col11a2; 2, Btnl2; 3, Bat1/Mccd1; 4, Pou5f1; 5, Gnl1; 6, Flj22638; 7, Trim39; 8, Trim26; 9, Tctex4; 10, Mog. Dotted lines link orthologous positions defined by genes 1-10 in the four species. Tctex4 is missing from the MHC of opossum. Question marks indicate that the borders of the class I/II region in platypus have not been cloned. Rat has three additional RT1-M gene blocks outside the interval shown. (b) Comparison of the class II region of rat and human, and the opossum class I/II region to platypus based on annotation of platypus BAC 462c1. Genes are color-coded: framework genes are shown in green; class I genes in red; class II α chains in light blue; and class II β chains in dark blue (for phylogenetic relations among class II genes, see Additional data file 2). Non-class I and non-class II genes or pseudogenes unique for a given species are displayed in grey. Hatching between BTNL2 and BTNL5 in opossum and between DRB1 and DRB9 in the HLA indicates that further BTNL or DRB genes are located within these intervals. Orthologous genes are linked by colored bars. (c) Detailed map of the Bat4 to Cdsn interval, including a class I gene block.
Figure 2
Figure 2
Platypus BACs and their gene content. (a) BAC clone 462c1, referred to as "BAC1" in the Results section (b) BAC 466a15 ("BAC2" in Results). Colors represent types of genes. Red: Class I genes; Blue: Class II genes; Green: Framework genes. Transcriptional orientation of genes is indicated by arrows.
Figure 3
Figure 3
Phylogenetic analysis of class II α chain genes. Cafa, Canis familiaris (dog); Hosa, Homo sapiens (human); Bota, Bos taurus (bovine); Rano, Rattus norvegicus (rat); Maru, Macropus rufogriseus (red-necked wallaby); Modo, Monodelphis domestica (opossum); Orcu, Oryctolagus cuniculus (rabbit); Eqca, Equus caballus (horse); Cacr, Caiman crocodilus (spectacled caiman); Gaga, Gallus gallus (chicken); Oran, Ornithorhynchus anatinus (platypus); Xela, Xenopus laevis (African clawed frog). The abbreviations used to describe taxonomic affiliation of each species in the tree are outlined in Figure 4a. A black diamond highlights platypus DRA. Tree construction using the NJ method is outlined in Materials and methods. Numbers indicate bootstrap support in percent. Branch lengths are proportional to number of substitutions. The scale bar indicates 20% substitutions per site. Sequences used and their accession numbers are listed in Additional data file 10.
Figure 4
Figure 4
Phylogenetic analysis of platypus MHC class I genes. (a) Species tree of taxonomic entities represented in the trees shown in Figures 3 and 4b. (b) MHC class I gene phylogenetic tree. Hosa, Homo sapiens (human); Eqca, Equus caballus (horse); Cafa, Canis familiaris (dog); Tube, Tupaia belangeri (Northern tree shrew); Orcu, Oryctolagus cuniculus (rabbit); Rano, Rattus norvegicus (rat); Modo, Monodelphis domestica (opossum); Isma, Isoodon macrourus (Northern brown bandicoot); Trvu, Trichosurus vulpecula (silver-grey brushtail possum); Maru, Macropus rufogriseus (red-necked wallaby); Maeu, Macropus eugenii (tammar wallaby); Oran, Ornithorhynchus anatinus (platypus); Taac, Tachyglossus aculeatus (echidna); Anpl, Anas platyrhynchos (duck); Gaga, Gallus gallus (chicken); Pesi, Pelodiscus sinensis (Chinese softshell turtle); Amam, Ameiva ameiva (lizard); Nesi, Nerodia sipedon (snake); Sppu, Sphenodon punctatus (tuatara); Amme, Ambystoma mexicanum (axolotl); Rapi, Rana pipiens (Northern leopard frog); Xela, Xenopus laevis (African clawed frog); Xetr, Xenopus tropicalis (Western clawed frog). Black diamonds highlight platypus class I sequences identified in this study. The marsupial Isoodon (Isma2-1-3) is represented by an artificial class I sequence that we generated from three separate overlapping class I sequence entries for this species. Tree construction using the NJ method was as described in Materials and methods. Numbers indicate bootstrap support in percent. Branch lengths are proportional to number of substitutions. The scale bar indicates 10% substitutions per site. Sequences used and their accession numbers are listed in Additional data file 11.
Figure 5
Figure 5
Chromosomal localization of MHC genes in platypus and echidna. (a) Platypus BAC clones 466a15 (green) and 462c1 (red) hybridized to male platypus metaphase spreads. Signals were identified on the pseudoautosomal regions of chromosomes Y4X5 and Y3X3. (b) FISH mapping of echidna BAC clones 287o10 (green) and clone 268a21 (red) on male echidna metaphase spreads. Signals were detected on the pseudoautosomal regions of Y3X3 and Y4X4.
Figure 6
Figure 6
Chromosomal localization of echidna MHC BAC clones in male meiotic metaphase I preparations. (a) BAC 48g5 (green) on Y3X3. (b) DAPI inverted picture. The elements of the chain are indicated by the bold lines; the elements containing MHC genes are shown in green. (c) Hybridization of BAC 268a21 on the meiotic chain. Chromosome telomeres are highlighted by hybridization of a telomere repeat (red). In (d) DAPI inverted picture. The elements at the end of the chain are indicated by the bold lines.
Figure 7
Figure 7
Model for the evolution of elements 6-10 in the male meiotic sex chromosome chains of platypus and echidna. Three events are proposed to have led to the observed arrangement of platypus and echidna sex chromosomes. An initial X-autosome translocation captured the MHC-containing chromosome into the sex chromosome system. In a second step, a sex chromosome-autosome translocation occurred that disrupted the synteny of the MHC. In the echidna lineage, a further translocation between two sex chromosomes took place (see Discussion for details).

Similar articles

Cited by

References

    1. Horton R, Wilming L, Rand V, Lovering RC, Bruford EA, Khodiyar VK, Lush MJ, Povey S, Talbot CC, Wright MW, et al. Gene map of the extended human MHC. Nat Rev Genet. 2004;5:889–899. doi: 10.1038/nrg1489. - DOI - PubMed
    1. Kulski JK, Shiina T, Anzai T, Kohara S, Inoko H. Comparative genomic analysis of the MHC: the evolution of class I duplication blocks, diversity and complexity from shark to man. Immunol Rev. 2002;190:95–122. doi: 10.1034/j.1600-065X.2002.19008.x. - DOI - PubMed
    1. Kelley J, Walter L, Trowsdale J. Comparative genomics of major histocompatibility complexes. Immunogenetics. 2005;56:683–695. doi: 10.1007/s00251-004-0717-7. - DOI - PubMed
    1. Hurt P, Walter L, Sudbrak R, Klages S, Müller I, Shiina T, Inoko H, Lehrach H, Günther E, Reinhardt R, et al. The genomic sequence and comparative analysis of the rat major histocompatibility complex. Genome Res. 2004;14:631–639. doi: 10.1101/gr.1987704. - DOI - PMC - PubMed
    1. MHC sequencing consortium Complete sequence and gene map of a human major histocompatibility complex. Nature. 1999;401:921–923. doi: 10.1038/44853. - DOI - PubMed

Publication types