Versatile annotation and publication quality visualization of protein complexes using POLYVIEW-3D
- PMID: 17727718
- PMCID: PMC1978507
- DOI: 10.1186/1471-2105-8-316
Versatile annotation and publication quality visualization of protein complexes using POLYVIEW-3D
Abstract
Background: Macromolecular visualization as well as automated structural and functional annotation tools play an increasingly important role in the post-genomic era, contributing significantly towards the understanding of molecular systems and processes. For example, three dimensional (3D) models help in exploring protein active sites and functional hot spots that can be targeted in drug design. Automated annotation and visualization pipelines can also reveal other functionally important attributes of macromolecules. These goals are dependent on the availability of advanced tools that integrate better the existing databases, annotation servers and other resources with state-of-the-art rendering programs.
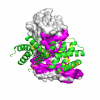
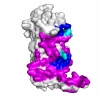
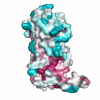
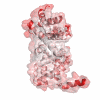
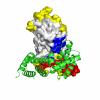
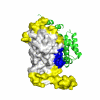
Results: We present a new tool for protein structure analysis, with the focus on annotation and visualization of protein complexes, which is an extension of our previously developed POLYVIEW web server. By integrating the web technology with state-of-the-art software for macromolecular visualization, such as the PyMol program, POLYVIEW-3D enables combining versatile structural and functional annotations with a simple web-based interface for creating publication quality structure rendering, as well as animated images for Powerpoint, web sites and other electronic resources. The service is platform independent and no plug-ins are required. Several examples of how POLYVIEW-3D can be used for structural and functional analysis in the context of protein-protein interactions are presented to illustrate the available annotation options.
Conclusion: POLYVIEW-3D server features the PyMol image rendering that provides detailed and high quality presentation of macromolecular structures, with an easy to use web-based interface. POLYVIEW-3D also provides a wide array of options for automated structural and functional analysis of proteins and their complexes. Thus, the POLYVIEW-3D server may become an important resource for researches and educators in the fields of protein science and structural bioinformatics. The new server is available at http://polyview.cchmc.org/polyview3d.html.
Figures
References
-
- DeLano WL. The PyMOL molecular graphics system http://www.pymol.org
-
- Jmol http://www.jmol.org
-
- Martz E, Kramer TD. World index of molecular visualization resources http://molvisindex.org
-
- Kraulis P. MolScript http://www.avatar.se/molscript/
Publication types
MeSH terms
Substances
Grants and funding
LinkOut - more resources
Full Text Sources
Other Literature Sources

