Review
. 2007 Oct;17(5):587-95.
doi: 10.1016/j.sbi.2007.06.008. Epub 2007 Aug 28.

Visualization software for molecular assemblies

Affiliations
Review

Visualization software for molecular assemblies

Thomas D Goddard et al. Curr Opin Struct Biol. 2007 Oct.

Abstract

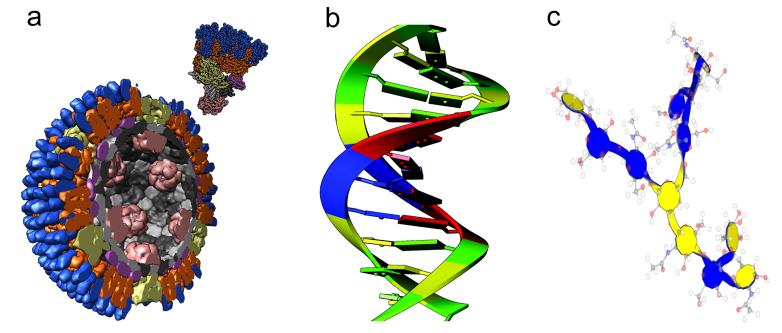
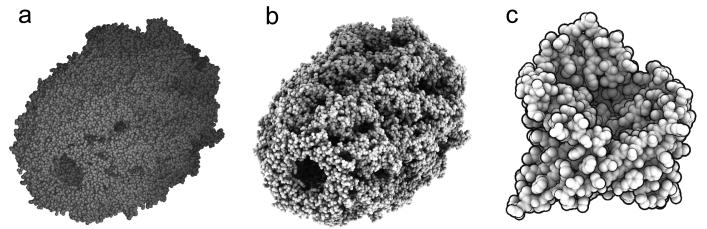
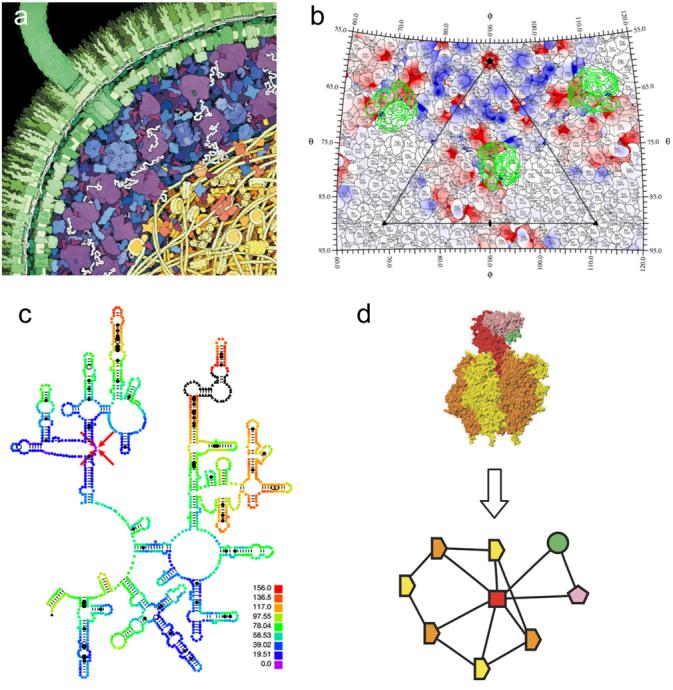
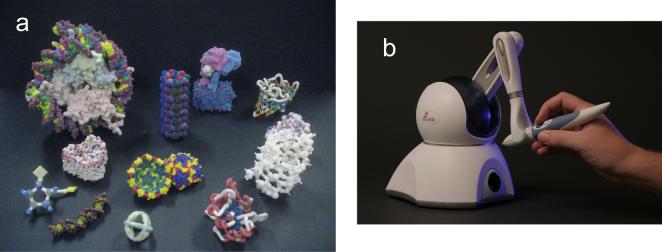
Software for viewing three-dimensional models and maps of viruses, ribosomes, filaments, and other molecular assemblies is advancing on many fronts. New developments include molecular representations that offer better control over level of detail, lighting that improves the perception of depth, and two-dimensional projections that simplify data interpretation. Programmable graphics processors offer quality, speed, and visual effects not previously possible, while 3D printers, haptic interaction devices, and auto-stereo displays show promise in more naturally engaging our senses. Visualization methods are developed by diverse groups of researchers with differing goals: experimental biologists, database developers, computer scientists, and package developers. We survey recent developments and problems faced by the developer community in bringing innovative visualization methods into widespread use.


Figures

Figure 1
Figure 1. Levels of detail
(a) Molecules depicted with low-resolution surfaces, orthoreovirus capsid (PDB 2cse). (b) Nucleic acid bases depicted as slabs [4]. (c) Carbohydrate depiction [5] with glucan ring top and bottom sides colored blue and yellow. Ball-and-stick model superimposed for reference.
Figure 2
Figure 2. Enhancing depth perception
(a) Standard lighting of a chaperonin model (PDB 1aon) with atoms displayed as spheres. (b) Ambient occlusion lighting of chaperonin model produced by QuteMol program. (c) Edge highlighting with thicker edges where larger jumps in depth occur. Images from [9].
Figure 3
Figure 3. Two-dimensional visualization methods
(a) E. coli cross-section [10]. The double-layered cell wall is shown in green, with a flagellum extending upward to the left. The cytoplasmic space is shown in blue, with ribosomes in purple. The nucleoid area is shown at the lower right, with DNA strands in yellow. (b) Roadmap of CVA21 virus and footprint of the ICAM-1 receptor [11]. The difference density between 145 and 160 Å radii, isolating the ICAM-1 receptor, is projected onto a stereographic diagram and contoured in green. The electrostatic potential is of CVA21 is shown in red and blue. (c) ColoRNA view of part of E. coli 23S ribosomal RNA [12] colored by distance from the residue indicated with red arrows. (d) Graph depiction of a molecular assembly from the 3D Complex database [15] shows SCOP domains [16] as symbols with lines indicating contacting domains. Homologous domains have the same symbol shape and identical domains have the same color.
Figure 4
Figure 4. Tactile models
(a) Physical molecular models created with 3D printers from Z Corporation (Burlington, MA, USA) and Stratasys (Eden Prairie, MN, USA) using Python Molecular Viewer software [21]. (b) Force feedback device from SensAble Technologies (Woburn, MA, USA) guides atomic models to maximum correlation locations in manual fitting with Sculptor [23] software.

References

    1. Macke TJ, Duncan BS, Goodsell DS, Olson AJ. Interactive modeling of supramolecular assemblies. J Mol Graph Model. 1998;16:115–120. 162-113. - PubMed
    1. Goddard TD, Huang CC, Ferrin TE. Software extensions to UCSF chimera for interactive visualization of large molecular assemblies. Structure. 2005;13:473–482. Describes software for viewing atomic models of viruses and other molecular assemblies composed of up to thousands of macromolecules. - PubMed
    1. Sanner MF. A component-based software environment for visualizing large macromolecular assemblies. Structure. 2005;13:447–462. - PubMed
    1. Couch GS, Hendrix DK, Ferrin TE. Nucleic acid visualization with UCSF Chimera. Nucleic Acids Res. 2006;34:e29. - PMC - PubMed
    1. Kuttel M, Gain J, Burger A, Eborn I. Techniques for visualization of carbohydrate molecules. J Mol Graph Model. 2006;25:380–388. - PubMed

Publication types

LinkOut - more resources