. 2007 Nov;81(22):12260-71.
doi: 10.1128/JVI.01304-07. Epub 2007 Aug 29.

Structure of adeno-associated virus serotype 8, a gene therapy vector

Affiliations

Structure of adeno-associated virus serotype 8, a gene therapy vector

Hyun-Joo Nam et al. J Virol. 2007 Nov.

Abstract

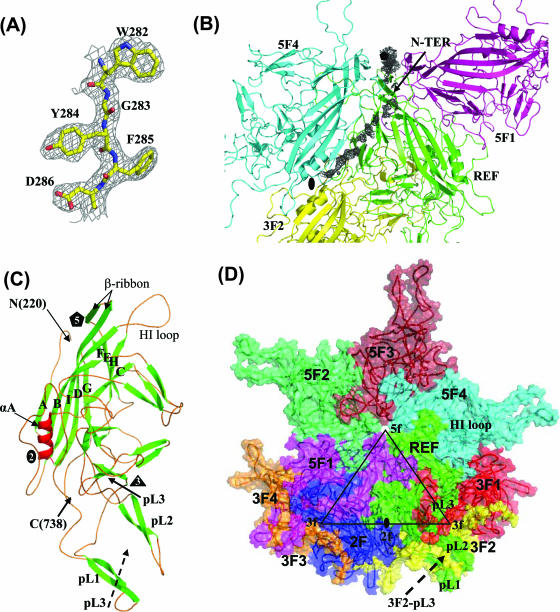
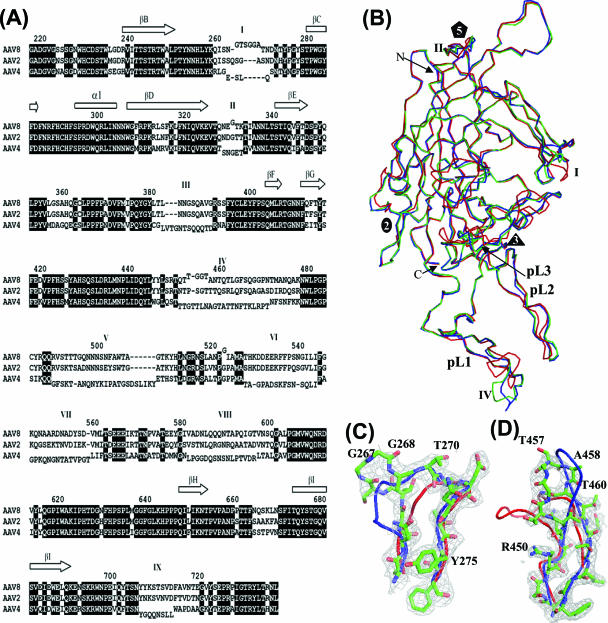
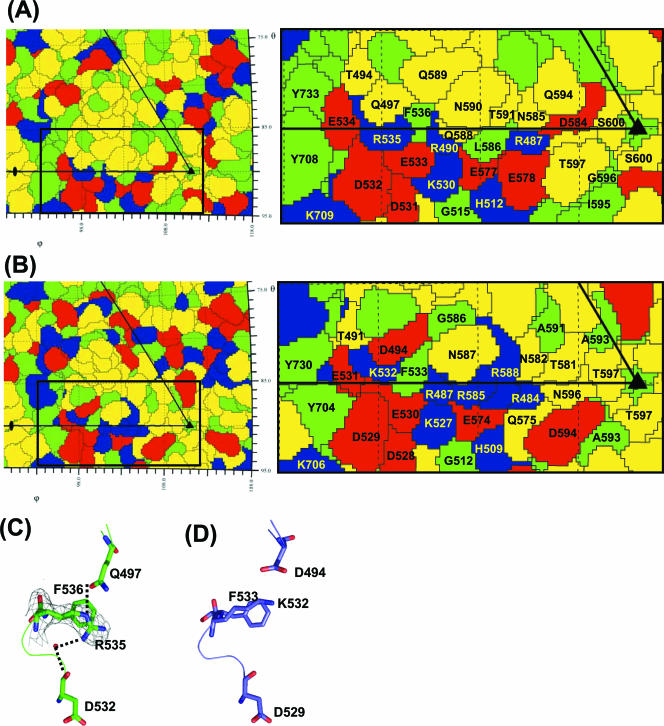
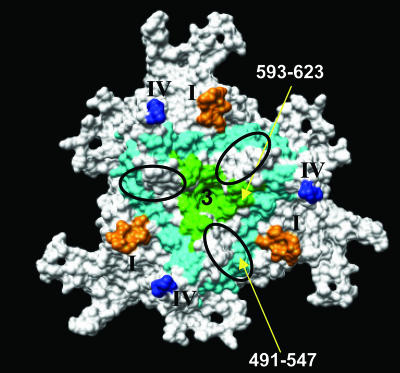
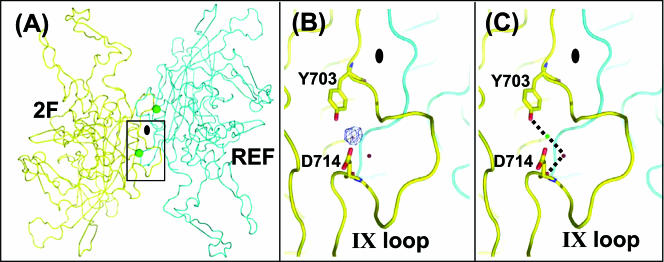
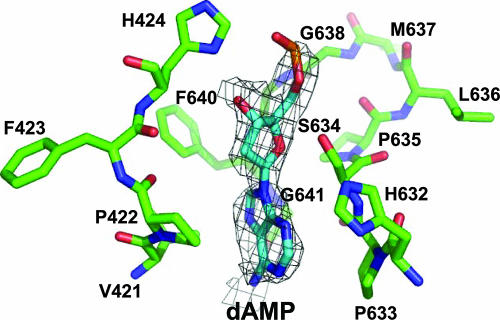
Adeno-associated viruses (AAVs) are being developed as gene therapy vectors, and their efficacy could be improved by a detailed understanding of their viral capsid structures. AAV serotype 8 (AAV8) shows a significantly greater liver transduction efficiency than those of other serotypes, which has resulted in efforts to develop this virus as a gene therapy vector for hemophilia A and familial hypercholesterolemia. Pseudotyping studies show that the differential tissue tropism and transduction efficiencies exhibited by the AAVs result from differences in their capsid viral protein (VP) amino acids. Towards identifying the structural features underpinning these disparities, we report the crystal structure of the AAV8 viral capsid determined to 2.6-A resolution. The overall topology of its common overlapping VP is similar to that previously reported for the crystal structures of AAV2 and AAV4, with an eight-stranded beta-barrel and long loops between the beta-strands. The most significant structural differences between AAV8 and AAV2 (the best-characterized serotype) are located on the capsid surface at protrusions surrounding the two-, three-, and fivefold axes at residues reported to control transduction efficiency and antibody recognition for AAV2. In addition, a comparison of the AAV8 and AAV2 capsid surface amino acids showed a reduced distribution of basic charge for AAV8 at the mapped AAV2 heparin sulfate receptor binding region, consistent with an observed non-heparin-binding phenotype for AAV8. Thus, this AAV8 structure provides an additional platform for mutagenesis efforts to characterize AAV capsid regions responsible for differential cellular tropism, transduction, and antigenicity for these promising gene therapy vectors.


Figures

FIG. 1.
FIG. 1.
Structure of AAV8. (A) Part of the 2Fo-Fc electron density map (gray mesh) for residues 282 to 286, contoured at 1.5σ. The map was calculated using data at a 2.6-Å resolution. The atoms are colored according to atom type. (B) Portion of Fo-Fc electron density map (gray) showing extra density at the fivefold channel and the inner surface of the capsid. Three of the fivefold symmetry-related VP monomers are shown, in green (REF = reference), magenta (5F1), and cyan (5F4), and a threefold monomer is shown in yellow (3F2). (C) Ribbon diagram of AAV8 VP3 showing the core eight-stranded β-barrel strands (green), stretches of small antiparallel β-strands (green), loops (orange), and a conserved parvoviral helical region (red). The first N-terminal residue observed (220), the C-terminal residue (738), the eight strands (βB to βI) that make up the core β-barrel, the loop between βH and βI (the HI loop), αA, and the loop regions (pL1 to pL3) that make up the protrusions that surround the icosahedral threefold axes are labeled. The locations of the five-, three-, and twofold axes are also labeled as black polygons. (D) AAV8 VP3s related to the reference monomer (REF) by five (5F1 to 5F4)-, three (3F)- and twofold (2F) symmetry relationships. The black triangle depicts a viral asymmetric unit bounded by five-, three-, and twofold icosahedral symmetry axes. The HI loop and pL1 to pL3 are labeled.
FIG. 2.
FIG. 2.
Superimposition of AAV structures. (A) Sequence/structure alignment of the AAV2, AAV4, and AAV8 VP3 amino acids. The core β-strands forming the β-barrel are represented as arrows at the top of the alignment, and variable regions I to IX (as defined in reference 18) are indicated above the sequence. VP regions that differ structurally between the viruses are offset above (for AAV8) and below (for AAV4) the alignment. The residue numbering above the alignment is based on AAV8 VP1 and refers to the center residue. (B) Superimposition of C-α atoms of AAV2 (blue), AAV4 (red), and AAV8 (green). The three loops at which AAV8 differs from AAV2 are located at variable regions I (residues 263 to 271), II (residues 329 to 333), and IV (residues 452 to 471). (C) Superimposition of the variable region I surface loops of AAV2 (blue), AAV4 (red), and AAV8 (green) and the 2Fo-Fc map of AAV8 (gray mesh). (D) Superimposition of the variable region IV loops and the 2Fo-Fc map of AAV8. The color scheme follows that of panel C.
FIG. 3.
FIG. 3.
Comparison of the AAV8, AAV2, and AAV4 capsids. Depth-cued surface representations of the AAV8 (green) (A), AAV2 (blue) (B), and AAV4 (red) (C) capsids are shown. The whole-capsid surface topologies are shown at the top, and close-up views of the threefold symmetry axis region are shown at the bottom. Locations of variable regions I, II, and IV are indicated by circles on the capsid surface of AAV8 and the close-up views.
FIG. 4.
FIG. 4.
Heparin sulfate binding phenotypes of AAV capsids. Slot blot analysis was performed with flowthrough (F), wash 1 (W), wash 2 (Wf), and elution (E) fractions of AAV2, AAV5, and AAV8 capsids following loading onto a heparin-agarose column. The loaded sample is shown in the sample (S) slot. AAV2, positive control; AAV5, negative control.
FIG. 5.
FIG. 5.
Comparison of AAV2 and AAV8 capsid surface residues at the mapped AAV2 heparin sulfate region. (A and B) Schematic “Roadmap” projections (60) of a section of the asymmetric unit surface residues on the capsid crystal structures of AAV8 and AAV2, respectively, with close-up views on the right. Red, acidic residues; blue, basic residues; yellow, polar residues; green, hydrophobic residues. The boundary for each residue is shown in black. The residues are labeled. (C) 2Fo-Fc electron density map (gray) of R535 contoured at 1σ and stick representation of residues that interact with this residue in AAV8. C-α traces of the residues are shown as coils. The side chain for this residue is highly ordered in the electron density map. Hydrogen bonds positioning the R535 side chain are shown as dotted lines. (D) Equivalent region of AAV2 to that shown for AAV8 in panel C. The side chain of K532 in AAV2 (C-α equivalent to AAV8 R535) is not involved in any VP interactions.
FIG. 6.
FIG. 6.
AAV8 binding site for 37/67-kDa LamR. An icosahedral threefold region is shown with stretches of amino acids reported to be involved in 37/67-kDa LamR binding by AAV8, colored in cyan (residues 491 to 547) and green (residues 593 to 623). The locations of variable loops I and IV are shown in orange and blue, respectively, and the heparin sulfate binding region is depicted with an oval.
FIG. 7.
FIG. 7.
Putative AAV8 ion binding site. (A) Overall view of the cation binding site close to the icosahedral twofold axis region. The cation binding site is depicted as a green sphere. The reference VP monomer is shown in cyan, and the twofold symmetry-related monomer is shown in yellow. The approximate twofold axis is shown as a filled oval. (B) Fo-Fc electron density map of native crystals (blue mesh). The view is a zoomed-in version of the boxed region in panel A. The map was generated using the CNS program (7) and is shown at a 4σ contour level. The typical density for a solvent molecule (in red) contoured at 4σ is shown for comparison. (C) The environment of the cation binding site. The view is the same as that for panel B. Residues making hydrogen bonds (dotted lines) with the cation (green sphere), i.e., Y703 and D714, and a solvent molecule (red sphere) are shown.
FIG. 8.
FIG. 8.
An ordered DNA nucleotide in the AAV8 capsid. A stick representation of the residues in the DNA binding pocket and the DNA molecule is shown within a piece of the Fo-Fc density map (gray mesh; contoured at 1.8σ). The amino acids are labeled and colored according to atom type, except for carbon, which is colored green. The model (energy minimized) shown is that of dAMP, although it is possible that the ordered base is a guanine.

References

    1. Agbandje-McKenna, M., and M. S. Chapman. 2006. Correlating structure with function in the viral capsid, p. 125-139. In J. R. Kerr, S. F. Cotmore, M. E. Bloom, R. M. Linden, and C. R. Parrish (ed.), Parvoviruses. Edward Arnold, Ltd., New York, NY.
    1. Agbandje-McKenna, M., A. L. Llamas-Saiz, F. Wang, P. Tattersall, and M. G. Rossmann. 1998. Functional implications of the structure of the murine parvovirus, minute virus of mice. Structure 6:1369-1381. - PubMed
    1. Akache, B., D. Grimm, K. Pandey, S. R. Yant, H. Xu, and M. A. Kay. 2006. The 37/67-kilodalton laminin receptor is a receptor for adeno-associated virus serotypes 8, 2, 3, and 9. J. Virol. 80:9831-9836. - PMC - PubMed
    1. Ardini, E., B. Sporchia, L. Pollegioni, M. Modugno, C. Ghirelli, F. Castiglioni, E. Tagliabue, and S. Menard. 2002. Identification of a novel function for 67-kDa laminin receptor: increase in laminin degradation rate and release of motility fragments. Cancer Res. 62:1321-1325. - PubMed
    1. Auth, D., and G. Brawerman. 1992. A 33-kDa polypeptide with homology to the laminin receptor: component of translation machinery. Proc. Natl. Acad. Sci. USA 89:4368-4372. - PMC - PubMed

Publication types