. 2007 Aug 29;27(35):9252-61.
doi: 10.1523/JNEUROSCI.1402-07.2007.

Effects of selective attention on the electrophysiological representation of concurrent sounds in the human auditory cortex

Affiliations

Effects of selective attention on the electrophysiological representation of concurrent sounds in the human auditory cortex

Aurélie Bidet-Caulet et al. J Neurosci. .

Abstract

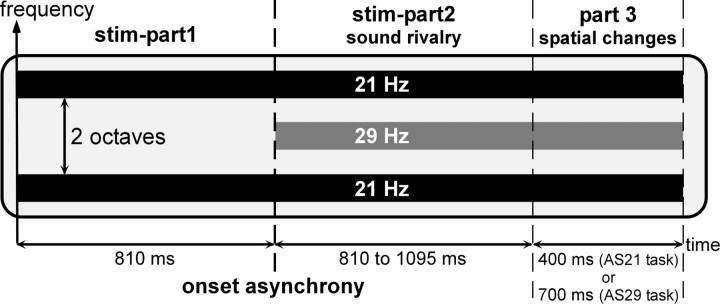
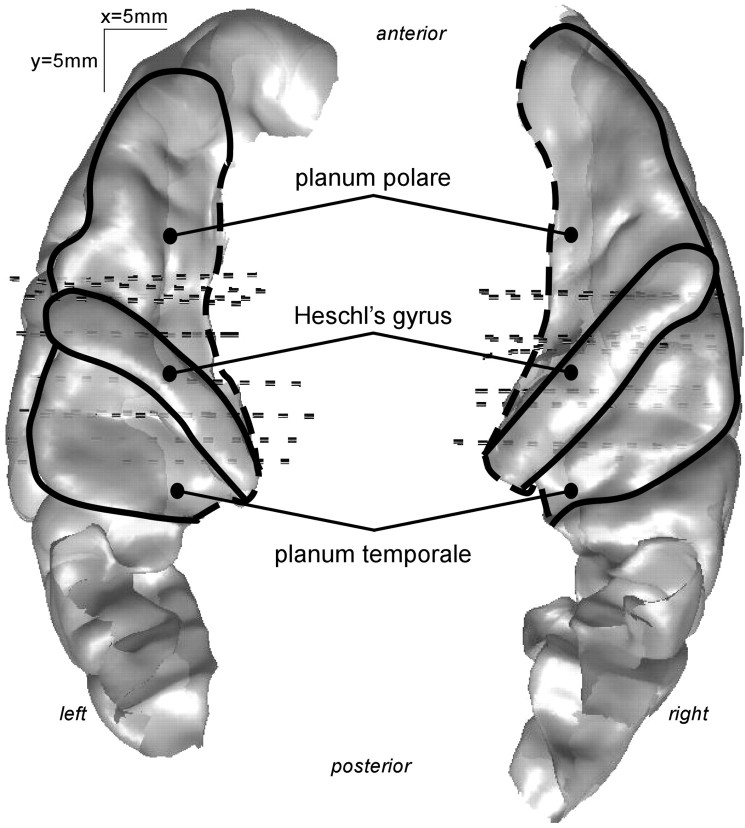
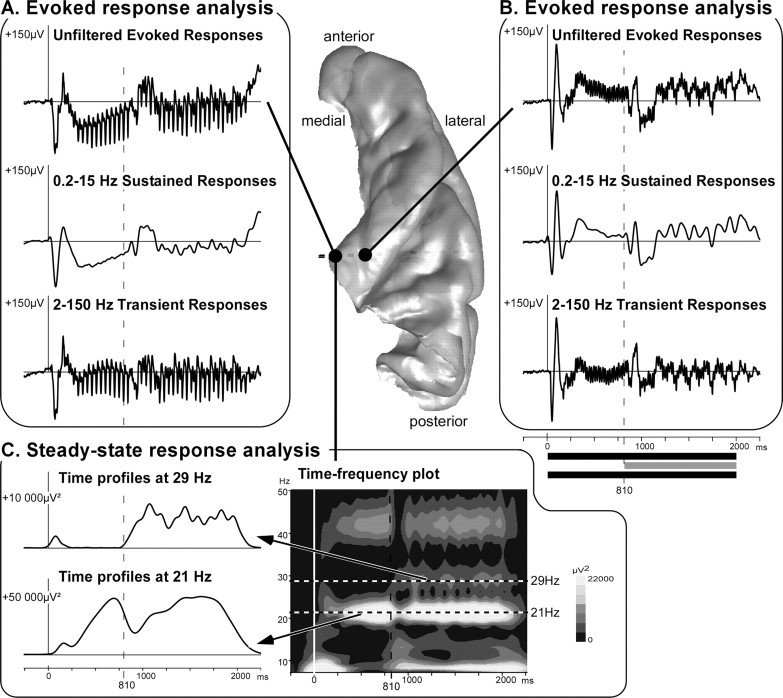
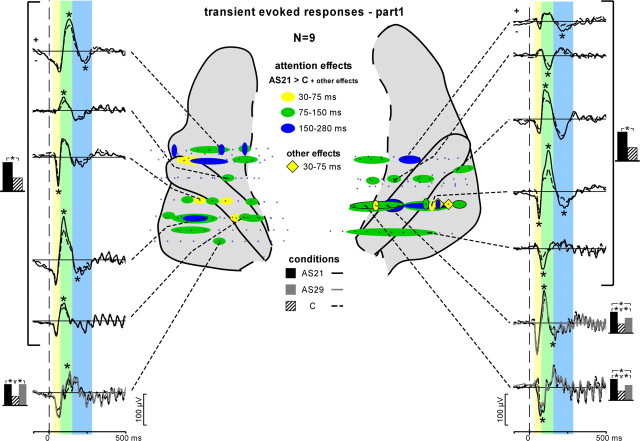
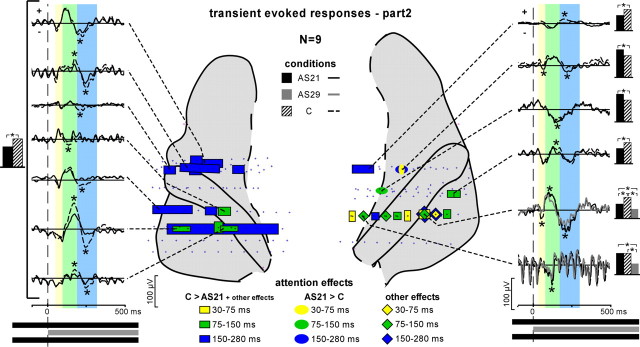
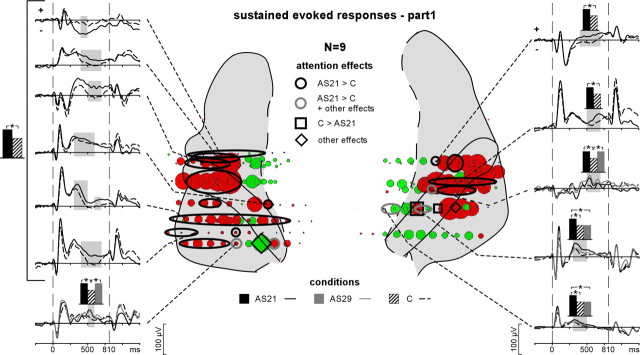
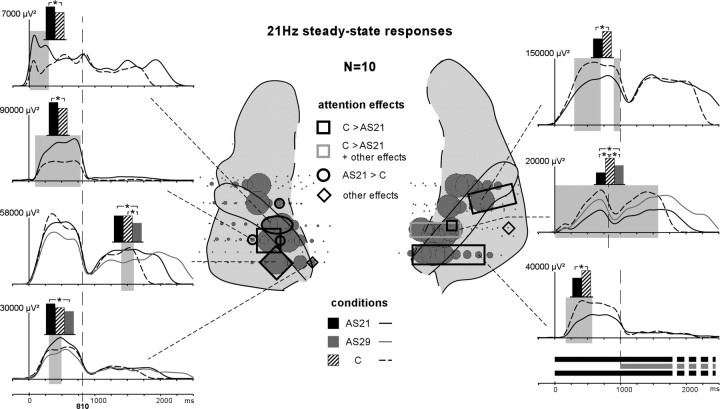
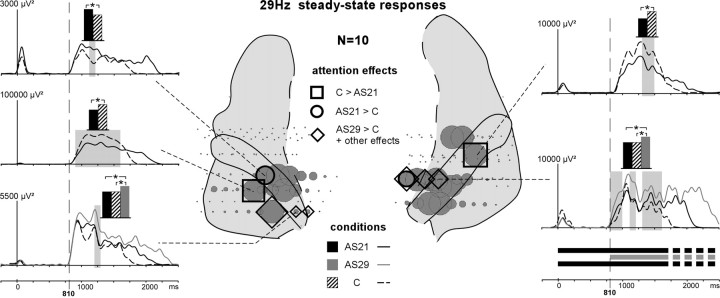
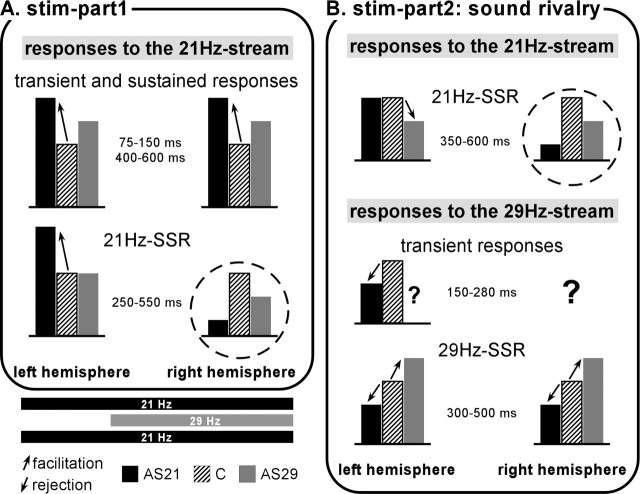
In noisy environments, we use auditory selective attention to actively ignore distracting sounds and select relevant information, as during a cocktail party to follow one particular conversation. The present electrophysiological study aims at deciphering the spatiotemporal organization of the effect of selective attention on the representation of concurrent sounds in the human auditory cortex. Sound onset asynchrony was manipulated to induce the segregation of two concurrent auditory streams. Each stream consisted of amplitude modulated tones at different carrier and modulation frequencies. Electrophysiological recordings were performed in epileptic patients with pharmacologically resistant partial epilepsy, implanted with depth electrodes in the temporal cortex. Patients were presented with the stimuli while they either performed an auditory distracting task or actively selected one of the two concurrent streams. Selective attention was found to affect steady-state responses in the primary auditory cortex, and transient and sustained evoked responses in secondary auditory areas. The results provide new insights on the neural mechanisms of auditory selective attention: stream selection during sound rivalry would be facilitated not only by enhancing the neural representation of relevant sounds, but also by reducing the representation of irrelevant information in the auditory cortex. Finally, they suggest a specialization of the left hemisphere in the attentional selection of fine-grained acoustic information.


Figures

Figure 1.
Figure 1.
Stimuli. The stimuli were composed of two acoustic streams: a 21 Hz stream and a 29 Hz stream. The 21 Hz stream (black bars) was composed of two amplitude-modulated tones separated by two octaves, the carrier frequency of the lower one being equiprobably chosen between 659, 698, 740, or 784 Hz. These two tones were both amplitude modulated in phase at a frequency of 21 Hz. The 29 Hz stream (gray bar) consisted of one tone separated by one octave from each tone of the first stream. This tone was amplitude modulated at a frequency of 29 Hz. The 21 Hz stream always started 810 ms before the 29 Hz stream (stim-part1). After the onset of the 29 Hz stream, starts a time period of sound rivalry (stim-part2) of 810–1095 ms duration. Because the two streams started at different times (onset asynchrony), auditory stream segregation was induced and two distinct streams could be perceived. In the two stream-selection attention tasks (AS21 and AS29), the stimuli included an additional part (part 3) with a duration of 400 or 700 ms, during which one stream or both were changing in spatial direction.
Figure 2.
Figure 2.
Delineation of the main auditory cortical regions on a top view of the superior temporal plane after 3D rendering of the cortical surface of the MNI standard brain. This schematic representation will be used in Figures 4 –8.
Figure 3.
Figure 3.
Illustration of the typical electrophysiological responses and their location in the 3D rendering of the temporal cortex of patient 10. A, B, The evoked response analysis consists of averaging single trials from EEG filtered with different bandwidth to dissociate transient and sustained responses. Top curves, Unfiltered evoked responses; middle curves, sustained responses obtained from 0.2–15 Hz filtered EEG; bottom curves, transient responses obtained from 2 to 150 Hz filtered EEG. The periodic steady-state activity is visible on the unfiltered and transient responses in A. C, The SSR analysis is based on a time-frequency transformation of electrophysiological activities (time-frequency power averaged after a wavelet-based transform of each single trial). Twenty-one, 29, and even 42 Hz steady-state evoked activities are clearly visible on the time-frequency plots. The time profiles of SSR power could then be constructed at 21 and 29 Hz from the time-frequency plots. All of these responses are baseline corrected with respect to a prestimulus period preceding the stimulus onset.
Figure 4.
Figure 4.
Attention effects on the transient evoked responses during stim-part1. Three transient evoked waves were found modulated by attention after stim-part1 onset: a first one between 30 and 75 ms (yellow), a second one between 75 and 150 ms (green) and a third one between 150 and 280 ms (blue). Ovals on the anatomical plots correspond to contacts where at least the AS21 > C effect was found, whereas diamonds correspond to contacts where any other effect (not the AS21 > C effect) was found. The time courses of these effects are depicted on the left and right sides of the figure. Evoked potentials waveforms were obtained by averaging the single trials from the 2–150 Hz filtered EEG. Transient evoked responses with significant difference between conditions are indicated by asterisks. The black, gray, and hatched boxes indicate which conditions are compared.
Figure 5.
Figure 5.
Attention effects on the transient evoked responses during stim-part2. Three transient evoked responses were found modulated by attention after stim-part2 onset: a first one between 30 and 75 ms (yellow), a second one between 75 and 150 ms (green), and a third one between 150 and 280 ms (blue). Squares on the anatomical plots correspond to contacts where at least the C > AS21 effect was found. Ovals correspond to contacts where only the AS21 > C effect was found. Diamonds correspond to contacts where any other effect (not the AS21 > C or C > AS21 effects) was found. The time courses of these effects are depicted on the left and right sides of the figure. The curves are obtained by averaging single trials from 2 to 150 Hz filtered EEG. Transient evoked responses with significant difference between conditions are indicated by asterisks. The black, gray, and hatched boxes indicate which conditions are compared.
Figure 6.
Figure 6.
Emergence and attention effects of the evoked sustained responses during stim-part1. The distribution of the sustained responses is indicated by disks (red, positive potentials; green, negative potentials) on the anatomical plots. The diameter of these disks correspond to the normalized (across all contacts of electrodes passing through the superior temporal cortex in all patients) mean amplitude of the sustained waves between 450 and 750 ms. Black squares on the schema correspond to contacts where only the C > AS21 effect was found. Black ovals correspond to contacts where only the AS21 > C effect was found and gray ovals correspond to contacts where at least the AS21 > C effect was found. Diamonds correspond to contacts where any other effect (not the AS21 > C or C > AS21 effects) was found. The time courses of these effects are depicted on the left and right sides of the figure (significant differences are indicated by gray shaded areas). The curves are obtained by averaging the single trials from 0.2–15 Hz filtered EEG and are baseline corrected with respect to the [−100, 0 ms] period preceding stim-part1. The black, gray, and hatched boxes indicate which conditions are compared.
Figure 7.
Figure 7.
Emergence and attention effects of the evoked 21 Hz SSR during parts 1 and 2. The distribution of the 21 Hz SSR is indicated by gray disks on the anatomical plots. The diameter of these disks correspond to the normalized (across contacts of each electrode passing through the superior temporal cortex in each patient) mean amplitude of the SSR between 450 and 750 ms (stim-part1). Black squares on the schema correspond to contacts where only the C > AS21 effect was found and gray squares correspond to contacts where at least the C > AS21 effect was found. Black ovals correspond to contacts where only the AS21 > C effect was found. Diamonds correspond to contacts where any other effect (not the AS21 > C or C > AS21 effects) was found. The time courses of these effects are depicted on the left and right sides of the figure (significant differences are indicated by gray shaded areas). The curves are obtained by computing the time profile at 21 Hz from the wavelet-based time-frequency decomposition. The black, gray, and hatched boxes indicate which conditions are compared.
Figure 8.
Figure 8.
Emergence and attention effects of the evoked 29 Hz SSR during stim-part2. The distribution of the 29 Hz SSR is indicated by gray disks. The diameters of these disks correspond to the normalized (across contacts of each electrode passing through the superior temporal cortex in each patient) mean amplitude of the SSR between 1100 and 1500 ms (stim-part2). Black squares on the schema correspond to contacts where only the C > AS21 effect was found whereas black ovals correspond to contacts where only the AS21 > C effect was found. Diamonds correspond to contacts where at least the AS29 > C effect (but not the AS21 > C or C > AS21 effects) was found. The time courses of these effects are depicted on the left and right sides of the figure (significant differences are indicated by gray shaded areas). The curves are obtained by computing the time profile at 29 Hz from the wavelet-based time-frequency decomposition. The black, gray, and hatched boxes indicate which conditions are compared.
Figure 9.
Figure 9.
Schematic representation of the main attentional effects. For each electrophysiological response, the main effects between conditions and their latencies, are arbitrarily schematized with black, gray, and hatched boxes. The amount of activity is depicted with the same height in the control condition (C), whereas it can be enhanced or reduced in the stream-selection attention conditions (AS21 and AS29). Effects corresponding to an attentional facilitation are indicated by up-pointing arrows (the representation of the relevant sound is increased). Effects corresponding to an attentional reduction are indicated by down-pointing arrows (the representation of the irrelevant sound is reduced). It is important to note that the results indicated for the AS29 condition correspond to two patients only, whereas results in the C and AS29 conditions correspond to 9 or 10 patients. Before the actual sound rivalry, transient and sustained evoked responses in both hemispheres, and 21 Hz SSR in the left hemisphere only, are enhanced by selective attention (compared with the control condition). During the situation of sound rivalry, in the left hemisphere, 21 Hz SSR is reduced when attention was directed to the other stream (AS29 condition). In the left hemisphere, transient responses are reduced when attention was directed to the other stream (AS21 condition). In both hemispheres, the 29 Hz SSR is enhanced (reduced) when the 29 Hz stream is attended (ignored). During both parts, in the right hemisphere, the attentional effects on 21 Hz SSR (hatched circles) are different from all other effects. This rather unexpected result suggests a specialization of the right and left auditory cortices in attentional processes.

References

    1. Ahveninen J, Jaaskelainen IP, Raij T, Bonmassar G, Devore S, Hamalainen M, Levanen S, Lin FH, Sams M, Shinn-Cunningham BG, Witzel T, Belliveau JW. Task-modulated “what” and “where” pathways in human auditory cortex. Proc Natl Acad Sci USA. 2006;103:14608–14613. - PMC - PubMed
    1. Alain C, Woods DL. Signal clustering modulates auditory cortical activity in humans. Percept Psychophys. 1994;56:501–516. - PubMed
    1. Alcaini M, Giard MH, Echallier JF, Pernier J. Selective auditory attention effects in tonotopically organized cortical areas: a topographic ERP study. Hum Brain Mapp. 1995;2:159–169.
    1. Alho K, Tottola K, Reinikainen K, Sams M, Näätänen R. Brain mechanism of selective listening reflected by event-related potentials. Electroencephalogr Clin Neurophysiol. 1987;68:458–470. - PubMed
    1. Alho K, Woods DL, Algazi A. Processing of auditory stimuli during auditory and visual attention as revealed by event-related potentials. Psychophysiology. 1994;31:469–479. - PubMed

LinkOut - more resources