

The representation of complex images in spatial frequency domains of primary visual cortex
- PMID: 17728445
- PMCID: PMC6673115
- DOI: 10.1523/JNEUROSCI.0500-07.2007
The representation of complex images in spatial frequency domains of primary visual cortex
Abstract
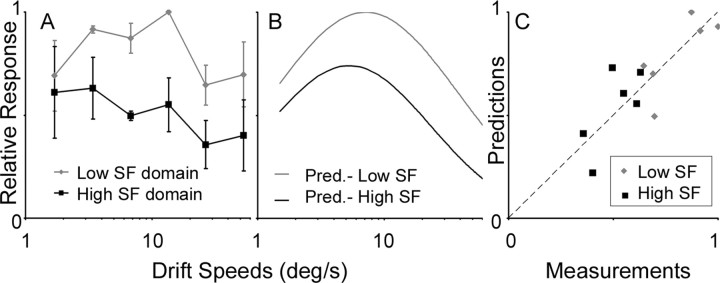
The organization of cat primary visual cortex has been well mapped using simple stimuli such as sinusoidal gratings, revealing superimposed maps of orientation and spatial frequency preferences. However, it is not yet understood how complex images are represented across these maps. In this study, we ask whether a linear filter model can explain how cortical spatial frequency domains are activated by complex images. The model assumes that the response to a stimulus at any point on the cortical surface can be predicted by its individual orientation, spatial frequency, and temporal frequency tuning curves. To test this model, we imaged the pattern of activity within cat area 17 in response to stimuli composed of multiple spatial frequencies. Consistent with the predictions of the model, the stimuli activated low and high spatial frequency domains differently: at low stimulus drift speeds, both domains were strongly activated, but activity fell off in high spatial frequency domains as drift speed increased. To determine whether the filter model quantitatively predicted the activity patterns, we measured the spatiotemporal tuning properties of the functional domains in vivo and calculated expected response amplitudes from the model. The model accurately predicted cortical response patterns for two types of complex stimuli drifting at a variety of speeds. These results suggest that the distributed activity of primary visual cortex can be predicted from cortical maps like those of orientation and SF preference generated using simple, sinusoidal stimuli, and that dynamic visual acuity is degraded at or before the level of area 17.
Figures


Similar articles
-
Cortical maps of separable tuning properties predict population responses to complex visual stimuli.J Neurophysiol. 2005 Jul;94(1):775-87. doi: 10.1152/jn.01093.2004. Epub 2005 Mar 9. J Neurophysiol. 2005. PMID: 15758052
-
Spatial and temporal frequency tuning in striate cortex: functional uniformity and specializations related to receptive field eccentricity.Eur J Neurosci. 2010 Mar;31(6):1043-62. doi: 10.1111/j.1460-9568.2010.07118.x. Epub 2010 Mar 3. Eur J Neurosci. 2010. PMID: 20377618
-
Prediction of orientation selectivity from receptive field architecture in simple cells of cat visual cortex.Neuron. 2001 Apr;30(1):263-74. doi: 10.1016/s0896-6273(01)00278-1. Neuron. 2001. PMID: 11343660
-
Cortical cartography revisited: A frequency perspective on the functional architecture of visual cortex.Prog Brain Res. 2006;154:121-34. doi: 10.1016/S0079-6123(06)54006-3. Prog Brain Res. 2006. PMID: 17010706 Review.
-
Processing of second-order stimuli in the visual cortex.Prog Brain Res. 2001;134:171-91. doi: 10.1016/s0079-6123(01)34013-x. Prog Brain Res. 2001. PMID: 11702543 Review.
Cited by
-
Whither the hypercolumn?J Physiol. 2009 Jun 15;587(Pt 12):2791-805. doi: 10.1113/jphysiol.2009.171082. J Physiol. 2009. PMID: 19525564 Free PMC article. Review.
-
Organization and origin of spatial frequency maps in cat visual cortex.J Neurosci. 2013 Aug 14;33(33):13326-43. doi: 10.1523/JNEUROSCI.4040-12.2013. J Neurosci. 2013. PMID: 23946391 Free PMC article.
-
The organization of spatial frequency maps measured by cortical flavoprotein autofluorescence.Vision Res. 2008 Jun;48(14):1545-53. doi: 10.1016/j.visres.2008.04.014. Epub 2008 Jun 3. Vision Res. 2008. PMID: 18511098 Free PMC article.
-
BOLD neurovascular coupling does not change significantly with normal aging.Hum Brain Mapp. 2017 Jul;38(7):3538-3551. doi: 10.1002/hbm.23608. Epub 2017 Apr 17. Hum Brain Mapp. 2017. PMID: 28419680 Free PMC article.
-
Unification of free energy minimization, spatiotemporal energy, and dimension reduction models of V1 organization: Postnatal learning on an antenatal scaffold.Front Comput Neurosci. 2022 Oct 14;16:869268. doi: 10.3389/fncom.2022.869268. eCollection 2022. Front Comput Neurosci. 2022. PMID: 36313813 Free PMC article.
References
-
- Adelson EH, Bergen JR. Spatiotemporal energy models for the perception of motion. J Opt Soc Am A. 1985;2:284–299. - PubMed
-
- Albrecht DG, Hamilton DB. Striate cortex of monkey and cat: contrast response function. J Neurophysiol. 1982;48:217–237. - PubMed
-
- Baker CL., Jr Spatial- and temporal-frequency selectivity as a basis for velocity preference in cat striate cortex neurons. Vis Neurosci. 1990;4:101–113. - PubMed
-
- Baker TI, Issa NP. Cortical maps of separable tuning properties predict population responses to complex visual stimuli. J Neurophysiol. 2005;94:775–787. - PubMed
Publication types
MeSH terms
Grants and funding
LinkOut - more resources
Full Text Sources
Miscellaneous