

Effects of signal-to-noise ratio on the accuracy and reproducibility of diffusion tensor imaging-derived fractional anisotropy, mean diffusivity, and principal eigenvector measurements at 1.5 T
- PMID: 17729339
- PMCID: PMC2862967
- DOI: 10.1002/jmri.21053
Effects of signal-to-noise ratio on the accuracy and reproducibility of diffusion tensor imaging-derived fractional anisotropy, mean diffusivity, and principal eigenvector measurements at 1.5 T
Abstract
Purpose: To develop an experimental protocol to calculate the precision and accuracy of fractional anisotropy (FA), mean diffusivity (MD), and the orientation of the principal eigenvector (PEV) as a function of the signal-to-noise ratio (SNR) in vivo.
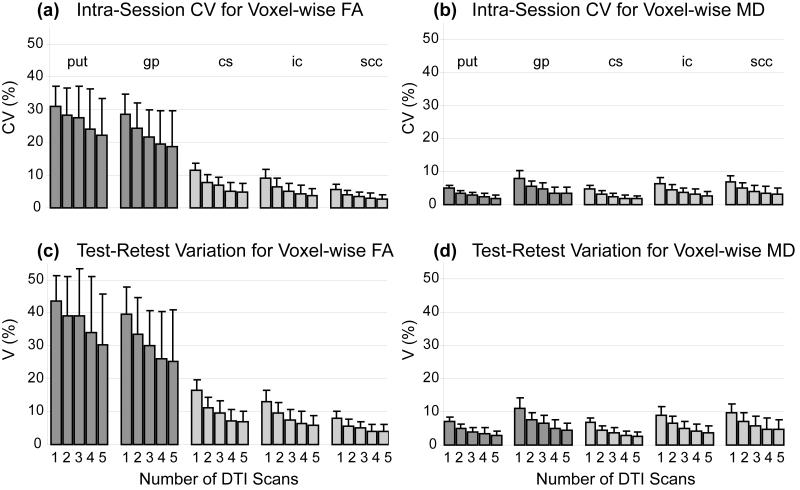
Materials and methods: A healthy male volunteer was scanned in three separate scanning sessions, yielding a total of 45 diffusion tensor imaging (DTI) scans. To provide FA, MD, and PEV as a function of SNR, sequential scans from a scan session were grouped into nonintersecting sets. Analysis of the accuracy and precision of the DTI-derived contrasts was done in both a voxel-wise and region of interest (ROI)-based manner.
Results: An upward bias of FA and no significant bias in MD were present as SNR decreased, confirming results from simulation-based studies. Notably, while the precision of the PEV became worse at low SNR, no bias in the PEV orientation was observed. Overall, an accurate and precise quantification of FA values in GM requires substantially more SNR than the quantification of white matter (WM) FA values
Conclusion: This study provides guidance for FA, MD, and PEV quantification and a means to investigate the minimal detectable differences within and across scan sessions as a function of SNR.
(c) 2007 Wiley-Liss, Inc.
Figures


Similar articles
-
Effects of diffusion weighting schemes on the reproducibility of DTI-derived fractional anisotropy, mean diffusivity, and principal eigenvector measurements at 1.5T.Neuroimage. 2007 Jul 15;36(4):1123-38. doi: 10.1016/j.neuroimage.2007.02.056. Epub 2007 Apr 4. Neuroimage. 2007. PMID: 17532649 Free PMC article.
-
Minimum SNR and acquisition for bias-free estimation of fractional anisotropy in diffusion tensor imaging - a comparison of two analytical techniques and field strengths.Magn Reson Imaging. 2012 Oct;30(8):1123-33. doi: 10.1016/j.mri.2012.04.015. Epub 2012 Jul 20. Magn Reson Imaging. 2012. PMID: 22819179
-
Angular versus spatial resolution trade-offs for diffusion imaging under time constraints.Hum Brain Mapp. 2013 Oct;34(10):2688-706. doi: 10.1002/hbm.22094. Epub 2012 Apr 21. Hum Brain Mapp. 2013. PMID: 22522814 Free PMC article.
-
The role of diffusion tensor imaging and fractional anisotropy in the evaluation of patients with idiopathic normal pressure hydrocephalus: a literature review.Neurosurg Focus. 2016 Sep;41(3):E12. doi: 10.3171/2016.6.FOCUS16192. Neurosurg Focus. 2016. PMID: 27581308 Review.
-
The role of diffusion tensor imaging in the evaluation of ischemic brain injury - a review.NMR Biomed. 2002 Nov-Dec;15(7-8):561-9. doi: 10.1002/nbm.786. NMR Biomed. 2002. PMID: 12489102 Review.
Cited by
-
Compressed Sensing Diffusion Spectrum Imaging for Accelerated Diffusion Microstructure MRI in Long-Term Population Imaging.Front Neurosci. 2018 Sep 24;12:650. doi: 10.3389/fnins.2018.00650. eCollection 2018. Front Neurosci. 2018. PMID: 30319336 Free PMC article.
-
A deep learning approach to estimation of subject-level bias and variance in high angular resolution diffusion imaging.Magn Reson Imaging. 2019 Jun;59:130-136. doi: 10.1016/j.mri.2019.03.021. Epub 2019 Mar 26. Magn Reson Imaging. 2019. PMID: 30926560 Free PMC article.
-
Diffusion tensor imaging and fiber tractography of the median nerve at 1.5T: optimization of b value.Skeletal Radiol. 2009 Jan;38(1):51-9. doi: 10.1007/s00256-008-0577-6. Epub 2008 Sep 5. Skeletal Radiol. 2009. PMID: 18773203
-
Investigating the tradeoffs between spatial resolution and diffusion sampling for brain mapping with diffusion tractography: time well spent?Hum Brain Mapp. 2014 Nov;35(11):5667-85. doi: 10.1002/hbm.22578. Epub 2014 Jul 5. Hum Brain Mapp. 2014. PMID: 25044786 Free PMC article.
-
Accelerated Cardiac Diffusion Tensor Imaging Using Joint Low-Rank and Sparsity Constraints.IEEE Trans Biomed Eng. 2018 Oct;65(10):2219-2230. doi: 10.1109/TBME.2017.2787111. Epub 2017 Dec 25. IEEE Trans Biomed Eng. 2018. PMID: 29989936 Free PMC article.
References
-
- Beaulieu C. The basis of anisotropic water diffusion in the nervous system - a technical review. NMR Biomed. 2002;15:435–455. - PubMed
-
- Beaulieu C, Allen PS. Determinants of anisotropic water diffusion in nerves. Magn Reson Med. 1994;31:394–400. - PubMed
-
- Henkelman RM, Stanisz GJ, Kim JK, Bronskill MJ. Anisotropy of NMR properties of tissues. Magn Reson Med. 1994;32:592–601. - PubMed
-
- Makris N, Worth AJ, Sorensen AG, et al. Morphometry of in vivo human white matter association pathways with diffusion-weighted magnetic resonance imaging. Ann Neurol. 1997;42:951–962. - PubMed
Publication types
MeSH terms
Grants and funding
LinkOut - more resources
Full Text Sources
