PKC epsilon and an increase in intracellular calcium concentration are necessary for PGF2 alpha to inhibit LH-stimulated progesterone secretion in cultured bovine steroidogenic luteal cells
- PMID: 17760987
- PMCID: PMC2041951
- DOI: 10.1186/1477-7827-5-37
PKC epsilon and an increase in intracellular calcium concentration are necessary for PGF2 alpha to inhibit LH-stimulated progesterone secretion in cultured bovine steroidogenic luteal cells
Abstract
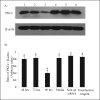
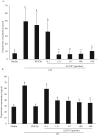
The hypotheses that PKC epsilon is necessary for: 1) PGF2 alpha to inhibit LH-stimulated progesterone (P4) secretion, and 2) for the expression of key prostaglandin synthesizing/metabolizing enzymes were tested in bovine luteal cells in which PKC epsilon expression had been ablated using a validated siRNA protocol. Steroidogenic cells from Day -6 bovine corpus luteum (CL) were isolated and transfected to reduce PKC epsilon expression after 48, 72 and 96 h. A third tested hypothesis was that an increase in intracellular calcium concentration ([Ca(2+)]i) is the cellular mechanism through which PGF2 alpha inhibits luteal progesterone. The hypothesis was tested with two pharmacological agents. In the first test, the dose-dependent effects on raising the [Ca(2+)]i with the ionophore, A23187, on basal and LH-stimulated P4 secretion in cells collected from early (Day -4) and mid-cycle (Day -10) bovine CL was examined. In the second test, the ability of PGF2 alpha to inhibit LH-stimulated P4 secretion in Day-10 luteal cells was examined under conditions in which an elevation in [Ca(2+)]i had been buffered by means of the intracellular calcium chelator, Bapta-AM.PKC epsilon expression was reduced 65 and 75% by 72 and 96 h after transfection, respectively. In cells in which PKC epsilon expression was ablated by 75%, the inhibitory effect of PGF2 alpha on LH-stimulated P4 secretion was only 29% lower than in the LH-stimulated group. In contrast, it was reduced by 75% in the group where PKC epsilon expression had not been reduced (P < 0.05). Real time PCR analysis indicated that there were no differences in the expression of cyclooxygenase-2 (COX-2), aldoketoreductase 1B5 (AKR1B5), prostaglandin E synthase (PGES), hydroxyprostaglandin-15 dehydrogenase (PGDH) and PGE2 -9-reductase as a function of PKC epsilon down-regulation. Finally, LH stimulated secretion of P4 at each luteal stage (Day -4 and -10), and PGF2 alpha inhibited this only in Day -10 cells (P < 0.05). When A23187 was used at concentrations greater than 0.1 mumol, the induced elevation in [Ca(2+)]i inhibited the effect of LH on secretion of P4 in Day -4 and -10 cells (P < 0.05, Fig. 5). The inhibitory effect of PGF2 alpha on LH-stimulated P4 in Day -10 cells was reduced if an increase in [Ca(2+)]i was prevented with Bapta-AM. These results support the hypothesis that differential expression of PKC epsilon and an elevation of [Ca(2+)]i are important for acquisition of luteolytic response to PGF2 alpha.
Figures


Similar articles
-
Calcium is an inhibitor of luteinizing hormone-sensitive adenylate cyclase in the luteal cell.Endocrinology. 1984 Apr;114(4):1208-15. doi: 10.1210/endo-114-4-1208. Endocrinology. 1984. PMID: 6323134
-
Release of progesterone by porcine luteal cells from different days of estrous cycle: effect of LH, PRL and PGF2 alpha.Endocrinol Exp. 1985 Jun;19(2):117-28. Endocrinol Exp. 1985. PMID: 3874767
-
Modulation of luteinizing hormone-stimulated inositol phosphate accumulation by phorbol esters in bovine luteal cells.Endocrinology. 1992 Aug;131(2):749-57. doi: 10.1210/endo.131.2.1322281. Endocrinology. 1992. PMID: 1322281
-
Loss of luteal sensitivity to luteinizing hormone underlies luteolysis in cattle: A hypothesis.Reprod Biol. 2021 Dec;21(4):100570. doi: 10.1016/j.repbio.2021.100570. Epub 2021 Nov 1. Reprod Biol. 2021. PMID: 34736159 Review.
-
Effect of histone-H2A (H-H2A), platelet activating factor (PAF) and pregnancy specific protein B (PSPB) on secretion of prostaglandins E and F2 alpha (PGE; PGF2 alpha) by bovine endometrium and H-H2A on basal secretion of luteinizing hormone (LH) by bovine pituitary cells in vitro.Chin J Physiol. 1996;39(3):147-54. Chin J Physiol. 1996. PMID: 8955561 Review.
Cited by
-
Genome-wide gene expression analysis reveals a dynamic interplay between luteotropic and luteolytic factors in the regulation of corpus luteum function in the bonnet monkey (Macaca radiata).Endocrinology. 2009 Mar;150(3):1473-84. doi: 10.1210/en.2008-0840. Epub 2008 Nov 6. Endocrinology. 2009. PMID: 18988674 Free PMC article.
-
Genotype-by-environment interaction in Holstein heifer fertility traits using single-step genomic reaction norm models.BMC Genomics. 2021 Mar 17;22(1):193. doi: 10.1186/s12864-021-07496-3. BMC Genomics. 2021. PMID: 33731012 Free PMC article.
-
Expression deregulation of matrix metalloproteinases and vasoconstriction related genes in Pakistani females with abnormal uterine bleeding.BMC Womens Health. 2022 Dec 23;22(1):543. doi: 10.1186/s12905-022-02132-y. BMC Womens Health. 2022. PMID: 36564776 Free PMC article.
-
Protein kinase C isoforms α, δ and ε are differentially expressed in mouse ovaries at different stages of postnatal development.J Ovarian Res. 2014 Dec 10;7:117. doi: 10.1186/s13048-014-0117-z. J Ovarian Res. 2014. PMID: 25491605 Free PMC article.
References
-
- McCracken JA, Custer EE, Lamsa JC. Luteolysis: a neuroendocrine-mediated event. Physiol Rev. 1999;79:263–323. - PubMed
-
- Niswender GD, Nett TM. Corpus luteum and its control in infraprimate species. In: Knobil E, Neill JD, editor. The Physiology of Reproduction. 2. Vol. 1. New York: Raven Press; 1994. pp. 781–816.
-
- Rexroad CE, Jr, Guthrie HD. Prostaglandin F2a and progesterone release in vitro by ovine luteal tissue during induced luteolysis. Adv Exp Med Biol. 1979;112:639–644. - PubMed
Publication types
MeSH terms
Substances
LinkOut - more resources
Full Text Sources
Research Materials
Miscellaneous

