

Optimization of filtering criterion for SEQUEST database searching to improve proteome coverage in shotgun proteomics
- PMID: 17761002
- PMCID: PMC2040164
- DOI: 10.1186/1471-2105-8-323
Optimization of filtering criterion for SEQUEST database searching to improve proteome coverage in shotgun proteomics
Abstract
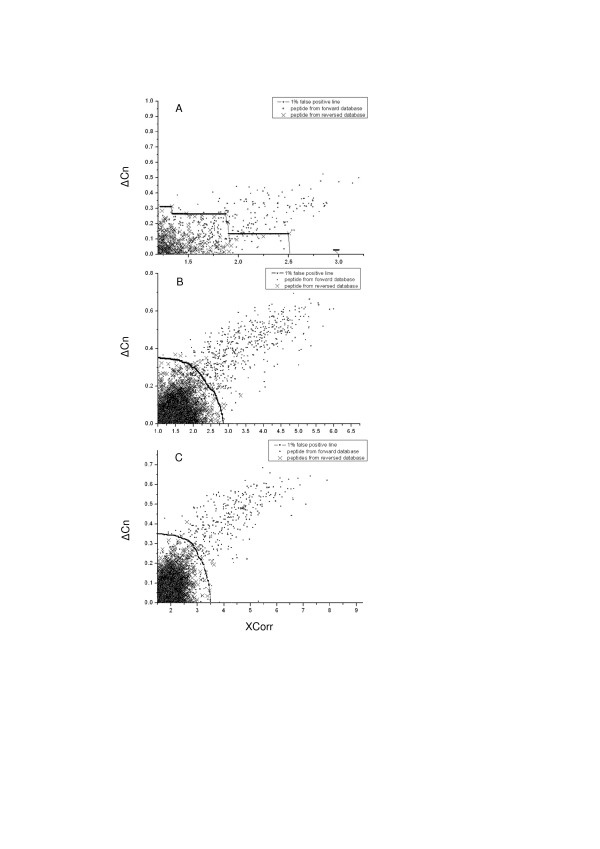
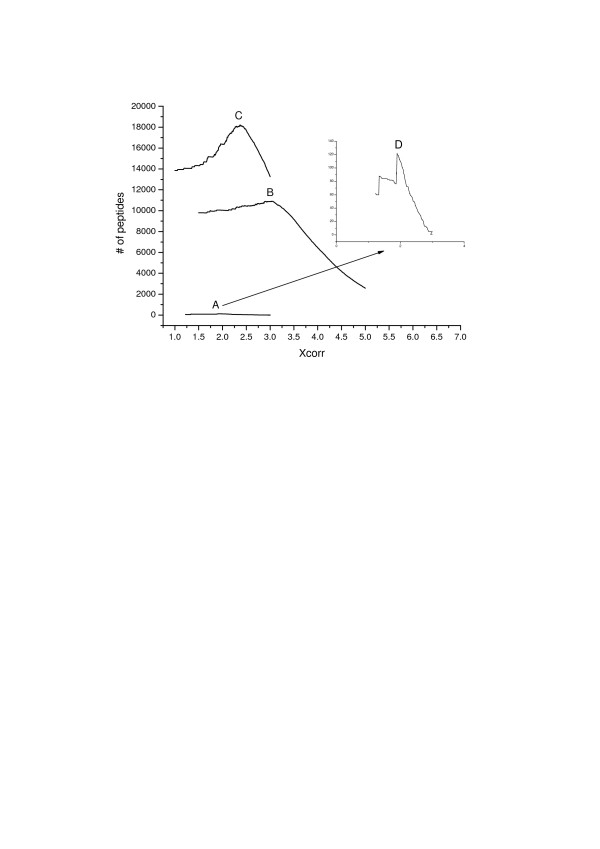
Background: In proteomic analysis, MS/MS spectra acquired by mass spectrometer are assigned to peptides by database searching algorithms such as SEQUEST. The assignations of peptides to MS/MS spectra by SEQUEST searching algorithm are defined by several scores including Xcorr, Delta Cn, Sp, Rsp, matched ion count and so on. Filtering criterion using several above scores is used to isolate correct identifications from random assignments. However, the filtering criterion was not favorably optimized up to now.
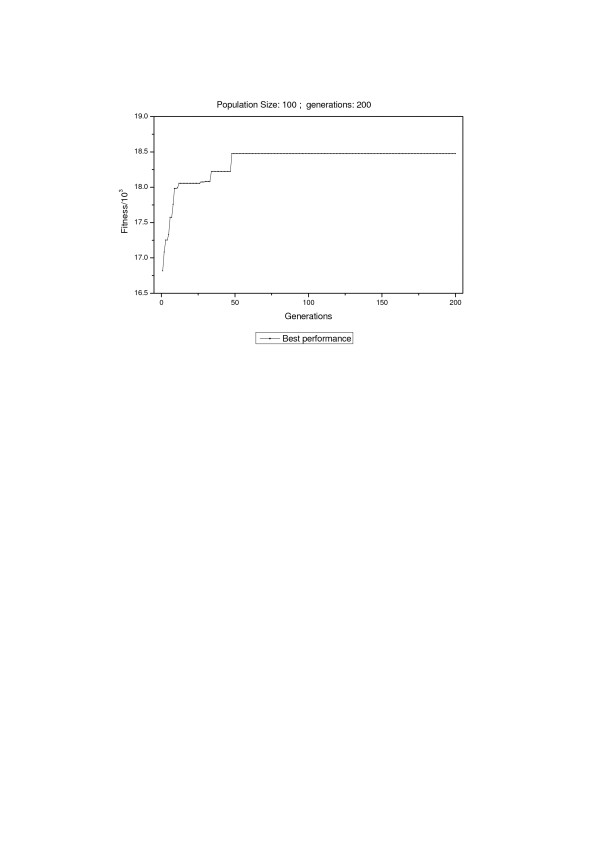
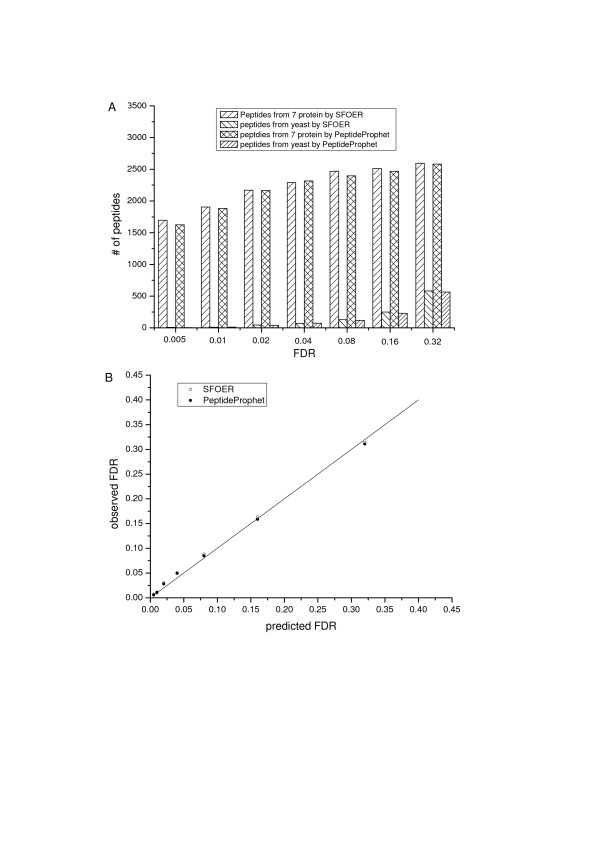
Results: In this study, we implemented a machine learning approach known as predictive genetic algorithm (GA) for the optimization of filtering criteria to maximize the number of identified peptides at fixed false-discovery rate (FDR) for SEQUEST database searching. As the FDR was directly determined by decoy database search scheme, the GA based optimization approach did not require any pre-knowledge on the characteristics of the data set, which represented significant advantages over statistical approaches such as PeptideProphet. Compared with PeptideProphet, the GA based approach can achieve similar performance in distinguishing true from false assignment with only 1/10 of the processing time. Moreover, the GA based approach can be easily extended to process other database search results as it did not rely on any assumption on the data.
Conclusion: Our results indicated that filtering criteria should be optimized individually for different samples. The new developed software using GA provides a convenient and fast way to create tailored optimal criteria for different proteome samples to improve proteome coverage.
Figures


Similar articles
-
Installation and use of the Computational Proteomics Analysis System (CPAS).Curr Protoc Bioinformatics. 2007 Jun;Chapter 13:Unit 13.5. doi: 10.1002/0471250953.bi1305s18. Curr Protoc Bioinformatics. 2007. PMID: 18428786
-
Added value for tandem mass spectrometry shotgun proteomics data validation through isoelectric focusing of peptides.J Proteome Res. 2005 Nov-Dec;4(6):2273-82. doi: 10.1021/pr050193v. J Proteome Res. 2005. PMID: 16335976
-
Optimization of Search Engines and Postprocessing Approaches to Maximize Peptide and Protein Identification for High-Resolution Mass Data.J Proteome Res. 2015 Nov 6;14(11):4662-73. doi: 10.1021/acs.jproteome.5b00536. Epub 2015 Sep 30. J Proteome Res. 2015. PMID: 26390080 Free PMC article.
-
Large-scale database searching using tandem mass spectra: looking up the answer in the back of the book.Nat Methods. 2004 Dec;1(3):195-202. doi: 10.1038/nmeth725. Nat Methods. 2004. PMID: 15789030 Review.
-
Protein identification by tandem mass spectrometry and sequence database searching.Methods Mol Biol. 2007;367:87-119. doi: 10.1385/1-59745-275-0:87. Methods Mol Biol. 2007. PMID: 17185772 Review.
Cited by
-
Ubiquitinated proteome: ready for global?Mol Cell Proteomics. 2011 May;10(5):R110.006882. doi: 10.1074/mcp.R110.006882. Epub 2011 Feb 21. Mol Cell Proteomics. 2011. PMID: 21339389 Free PMC article. Review.
-
Dynamics of the lipid droplet proteome of the Oleaginous yeast rhodosporidium toruloides.Eukaryot Cell. 2015 Mar;14(3):252-64. doi: 10.1128/EC.00141-14. Epub 2015 Jan 9. Eukaryot Cell. 2015. PMID: 25576482 Free PMC article.
-
Identification of outer membrane proteins from an Antarctic bacterium Pseudomonas syringae Lz4W.Mol Cell Proteomics. 2011 Jun;10(6):M110.004549. doi: 10.1074/mcp.M110.004549. Epub 2011 Mar 29. Mol Cell Proteomics. 2011. PMID: 21447709 Free PMC article.
-
Target-decoy search strategy for mass spectrometry-based proteomics.Methods Mol Biol. 2010;604:55-71. doi: 10.1007/978-1-60761-444-9_5. Methods Mol Biol. 2010. PMID: 20013364 Free PMC article.
-
A novel algorithm for validating peptide identification from a shotgun proteomics search engine.J Proteome Res. 2013 Mar 1;12(3):1108-19. doi: 10.1021/pr300631t. Epub 2013 Feb 12. J Proteome Res. 2013. PMID: 23402659 Free PMC article.
References
-
- Florens L, Washburn MP, Raine JD, Anthony RM, Grainger M, Haynes JD, Moch JK, Muster N, Sacci JB, Tabb DL, Witney AA, Wolters D, Wu YM, Gardner MJ, Holder AA, Sinden RE, Yates JR, Carucci DJ. A proteomic view of the Plasmodium falciparum life cycle. Nature. 2002;419:520–526. doi: 10.1038/nature01107. - DOI - PubMed
Publication types
MeSH terms
Substances
LinkOut - more resources
Full Text Sources
Research Materials
