. 2007 Nov;293(5):R1787-97.
doi: 10.1152/ajpregu.00059.2007. Epub 2007 Aug 29.

Mechanisms of impaired calcium handling underlying subclinical diastolic dysfunction in diabetes

Affiliations

Mechanisms of impaired calcium handling underlying subclinical diastolic dysfunction in diabetes

Véronique A Lacombe et al. Am J Physiol Regul Integr Comp Physiol. 2007 Nov.

Abstract

Isolated diastolic dysfunction is found in almost half of asymptomatic patients with well-controlled diabetes and may precede diastolic heart failure. However, mechanisms that underlie diastolic dysfunction during diabetes are not well understood. We tested the hypothesis that isolated diastolic dysfunction is associated with impaired myocardial Ca(2+) handling during type 1 diabetes. Streptozotocin-induced diabetic rats were compared with age-matched placebo-treated rats. Global left ventricular myocardial performance and systolic function were preserved in diabetic animals. Diabetes-induced diastolic dysfunction was evident on Doppler flow imaging, based on the altered patterns of mitral inflow and pulmonary venous flows. In isolated ventricular myocytes, diabetes resulted in significant prolongation of action potential duration compared with controls, with afterdepolarizations occurring in diabetic myocytes (P < 0.05). Sustained outward K(+) current and peak outward component of the inward rectifier were reduced in diabetic myocytes, while transient outward current was increased. There was no significant change in L-type Ca(2+) current; however, Ca(2+) transient amplitude was reduced and transient decay was prolonged by 38% in diabetic compared with control myocytes (P < 0.05). Sarcoplasmic reticulum Ca(2+) load (estimated by measuring the integral of caffeine-evoked Na(+)-Ca(2+) exchanger current and Ca(2+) transient amplitudes) was reduced by approximately 50% in diabetic myocytes (P < 0.05). In permeabilized myocytes, Ca(2+) spark amplitude and frequency were reduced by 34 and 20%, respectively, in diabetic compared with control myocytes (P < 0.05). Sarco(endo)plasmic reticulum Ca(2+)-ATPase-2a protein levels were decreased during diabetes. These data suggest that in vitro impairment of Ca(2+) reuptake during myocyte relaxation contributes to in vivo diastolic dysfunction, with preserved global systolic function, during diabetes.


Figures

Fig. 1
Fig. 1
Left ventricle (LV) contractile function is unchanged in diabetic rats. A: representative paired M-mode echocardiograms at baseline and at 8 wk after streptozotocin (STZ) injection. IVS, interventricular septum; LVPW, left ventricular posterior wall; RV, right ventricle. B: left ventricular (LV) ejection fraction, a surrogate of global systolic function, at baseline and at 8 wk after STZ or placebo injection in diabetic (n = 8) and age-matched controls (n = 7), respectively. C: LV Doppler myocardial performance (Tei) index at baseline and at 8 wk after STZ or placebo injection in diabetic (n = 8) and age-matched controls (n = 7), respectively. Data are expressed as means ± SE.
Fig. 2
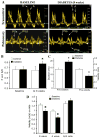
Fig. 2
Diastolic dysfunction occurs in diabetic rats. A: representative pulsed-wave Doppler images of mitral inflow and pulmonary venous flow velocities in a diabetic rat at baseline and at 8 wk of diabetes of maximal early (E) and late (A) diastolic flow velocities. PVs, systolic flow; PVd, diastolic flow; PVa, atrial reversal flow. The scale in milliseconds is shown; sweep speed is 200 mm/s. B: systolic-to-diastolic (S/D) velocity ratios of the pulmonary (P) veins in diabetic (n = 8) and age-matched control rats (n = 7) at baseline and at 8 wk of diabetes. *P < 0.05 when comparing values at baseline vs. at 8 wk. C: atrial reversal wave velocity and duration at baseline (n = 8) and at 8 wk of diabetes (n = 8). *P < 0.05. D: velocities of the E and A waves, and E-to-A ratio at baseline (n = 4) and at 8 wk of diabetes (n = 5). *P < 0.05 when comparing values at baseline vs. at 8 wk.
Fig. 3
Fig. 3
Action potential (AP) prolongation and presence of afterdepolarizations in diabetic myocytes. A: representative AP in diabetic (solid line) and age-matched control rat (dashed line) (0.5 Hz). B: AP duration at 50% and 95% of repolarization (APD50 and APD95, respectively), in diabetic (n = 7–10) and control (n = 6 –11) cardiac myocytes at 1 and 2 Hz. C: representative APs in a diabetic myocyte displaying early afterdepolarizations (*). D: percentage of diabetic and control cardiac myocytes displaying afterdepolarizations. The number on the bars corresponds to the total number of cells. *P < 0.05 when comparing values from control vs. diabetic myocytes.
Fig. 4
Fig. 4
Outward sustained K+ currents (IKsus) and outward rectifier K+ current (IK1) are reduced in diabetes-induced diastolic dysfunction, while transient outward current (Ito) is increased. A: average current-voltage (IV) relationship for Ito. Open and closed squares represent control (n = 8) and diabetic (n = 8) myocytes, respectively. B: average I - V relationship for IKsus. C: average I - V relationship for inward IK1. D: inward slope conductance of IK1 measured between −140 mV and −100 mV of IK1 I - V curve (refer to C) in control (n = 5) and in diabetic (n = 7) cardiac myocytes. E: peak outward IK1 measured at −60 mV (refer to C) in control (white bar) and in diabetic (black bars) cardiac myocytes. *P < 0.05 vs. control; pA/pF, picoamperes/picofarads.
Fig. 5
Fig. 5
Diabetes reduces L-type Ca current (ICa)-induced Ca2+ transients and sarcoplasmic reticulum (SR) Ca2+ content when measured in intact patch-clamped myocytes. A: representative confocal line scan images of Ca2+ transients (top) along with their spatial averages (middle) and recordings of ICa (bottom), induced by a depolarizing step from −50 to 0 mV, in control (left, n = 10) and diabetic (right, n = 6) myocytes. F0, diastolic fluorescence. Average amplitudes of intracellular Ca2+ concentration ([Ca2+]i)-induced Ca2+ transients (B) and peak ICa densities as functions of membrane potential (C) in age-matched control (black) and diabetic (red) cardiac myocytes. D: Excitation contraction coupling gain (amplitude of the fluorescent signal divided by the integral of Ca2+ current) in control and diabetic myocytes. E: representative raw tracing of Ca2+ fluorescent signals (top) and sodium-calcium exchanger (NCX) currents (bottom) in diabetic and control myocytes after application of 10 mM caffeine. F: caffeine-induced Ca2+ transient amplitudes are reduced in diabetic compared with control myocytes. G: integral of NCX (∫INCX) after caffeine application in diabetic and age-matched control myocytes. *P < 0.05 when comparing values from control vs. diabetic myocytes.
Fig. 6
Fig. 6
Ca2+ sparks and SR Ca2+ content are reduced in permeabilized myocytes from diabetic rats. A: representative line scan images of Ca2+ sparks. B: averaged surface plots of Ca2+ sparks (plots were obtained by averaging of 20% of the biggest events). C: pooled data for spark amplitude, n = 928 and 1,130 events for normal and diabetic respectively, *P < 0.001 when comparing values from control vs. diabetic myocytes. D: pooled data for spark frequency; n = 68 and 138 cells for normal and diabetic respectively, **P < 0.05. E: representative time-dependent profiles of caffeine-induced Ca2+ transients recorded in control (black) and diabetic (red) myocytes. F: pooled data for amplitude of caffeine-induced transients, n = 14 and 28 for normal and diabetic myocytes respectively. Experiments were performed on 8 diabetic heart preparations and 4 age-matched control Wistar rats.
Fig. 7
Fig. 7
Expression of diastolic SR Ca2+ handling proteins in normal and diabetic myocytes. A: representative immunoblots of sarco(endo)plasmic reticulum Ca2+-ATPase (SERCA)2a, phospholamban (PLB), serine 16 phosphorylated PLB, and calsequestrin (CASQ2) in control (Con) and diabetic (Diab) myocytes. B: normalized optical density (OD; relative to controls) of SERCA2a from diabetic hearts was reduced by 33% compared with controls (n = 10; *P < 0.05), whereas there were no significant changes in expression levels of other proteins (n from 6 to 10).

Similar articles

Cited by

References

    1. Abe T, Ohga Y, Tabayashi N, Kobayashi S, Sakata S, Misawa H, Tsuji T, Kohzuki H, Suga H, Taniguchi S, Takaki M. Left ventricular diastolic dysfunction in type 2 diabetes mellitus model rats. Am J Physiol Heart Circ Physiol. 2002;282:H138–H148. - PubMed
    1. Akiyama N, Okumura K, Watanabe Y, Hashimoto H, Ito T, Ogawa K, Satake T. Altered acetylcholine and norepinephrine concentrations in diabetic rat hearts. Role of parasympathetic nervous system in diabetic cardiomyopathy. Diabetes. 1989;38:231–236. - PubMed
    1. Akula A, Kota MK, Gopisetty SG, Chitrapu RV, Kalagara M, Kalagara S, Veeravalli KK, Gomedhikam JP. Biochemical, histological and echocardiographic changes during experimental cardiomyopathy in STZ-induced diabetic rats. Pharmacol Res. 2003;48:429–435. - PubMed
    1. Aurigemma GP, Zile MR, Gaasch WH. Contractile behavior of the left ventricle in diastolic heart failure: with emphasis on regional systolic function. Circulation. 2006;113:296–304. - PubMed
    1. Belke DD, Dillmann WH. Altered cardiac calcium handling in diabetes. Curr Hypertens Rep. 2004;6:424–429. - PubMed

Publication types

MeSH terms

Substances

LinkOut - more resources