. 2007 Oct 26;282(43):31217-27.
doi: 10.1074/jbc.M705098200. Epub 2007 Aug 30.

Respiratory deficiency mediates the regulation of CHO1-encoded phosphatidylserine synthase by mRNA stability in Saccharomyces cerevisiae

Affiliations

Respiratory deficiency mediates the regulation of CHO1-encoded phosphatidylserine synthase by mRNA stability in Saccharomyces cerevisiae

Hyeon-Son Choi et al. J Biol Chem. .

Abstract

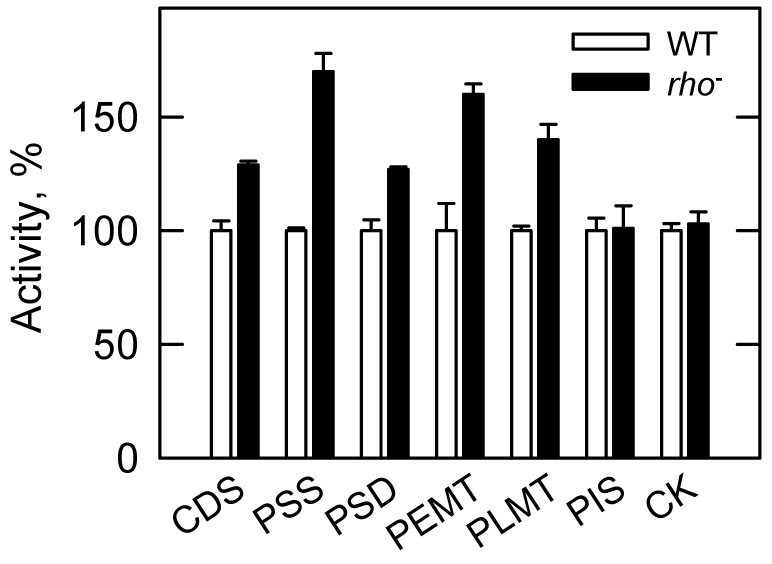
The CHO1-encoded phosphatidylserine synthase (CDP-diacylglycerol:l-serine O-phosphatidyltransferase, EC 2.7.8.8) is one of the most highly regulated phospholipid biosynthetic enzymes in the yeast Saccharomyces cerevisiae. CHO1 expression is regulated by nutrient availability through a regulatory circuit involving a UAS(INO) cis-acting element in the CHO1 promoter, the positive transcription factors Ino2p and Ino4p, and the transcriptional repressor Opi1p. In this work, we examined the post-transcriptional regulation of CHO1 by mRNA stability. CHO1 mRNA was stabilized in mutants defective in deadenylation (ccr4Delta), mRNA decapping (dcp1), and the 5'-3'-exonuclease (xrn1), indicating that the CHO1 transcript is primarily degraded through the general 5'-3' mRNA decay pathway. In respiratory-sufficient cells, the CHO1 transcript was moderately stable with a half-life of 12 min. However, the CHO1 transcript was stabilized to a half-life of >45 min in respiratory-deficient (rho(-) and rho(o)) cells, the cox4Delta mutant defective in the cytochrome c oxidase, and wild type cells treated with KCN (a cytochrome c oxidase inhibitor). The increased CHO1 mRNA stability in response to respiratory deficiency caused increases in CHO1 mRNA abundance, phosphatidylserine synthase protein and activity, and the synthesis of phosphatidylserine in vivo. Respiratory deficiency also caused increases in the activities of CDP-diacylglycerol synthase, phosphatidylserine decarboxylase, and the phospholipid methyltransferases. Phosphatidylinositol synthase and choline kinase activities were not affected by respiratory deficiency. This work advances our understanding of phosphatidylserine synthase regulation and underscores the importance of mitochondrial respiration to the regulation of phospholipid synthesis in S. cerevisiae.


Figures

FIGURE 1
FIGURE 1. Phospholipid synthetic pathways in S. cerevisiae
The pathways shown for the synthesis of phospholipids include the relevant steps discussed throughout the paper. The genes encoding enzymes responsible for the reactions in the CDP-DAG and Kennedy pathways are indicated in the figure. PA, phosphatidate; CDP-DAG, CDP-diacylglycerol; PI, phosphatidylinositol; PS, phosphatidylserine; PE, phosphatidylethanolamine; PC, phosphatidylcholine; DAG, diacylglycerol; P-choline, phosphocholine; P-ethanolamine, phosphoethanolamine.
FIGURE 2
FIGURE 2. Effects of the ccr4Δ, dcp1Δ, and xrn1Δ mutations on CHO1 mRNA decay
Wild type (WT, yRP840 for ccr4Δ and xrn1Δ, and yRP841 for dcp1Δ), ccr4Δ (yRP1616), dcp1Δ (yRP1069), and xrn1Δ (yRP884) mutant cells were grown to the exponential phase (1×10⁷ cells/ml) of growth. Following the arrest of transcription, 5-ml samples were taken every 5 min, total RNA was extracted, and the levels of CHO1 mRNA and PGK1 mRNA were determined by Northern blot analysis. The relative amounts of CHO1 and PGK1 mRNAs were determined by ImageQuant analysis. The figure shows a plot of the log of the relative amount of CHO1 to PGK1 mRNAs versus time. The lines drawn were the result of a least-squares analysis of the data. The data shown in the figure are representative of three independent experiments. Half-life values are presented in Table 3.
FIGURE 3
FIGURE 3. Effects of the cki1Δ, eki1Δ, and cki1Δ eki1Δ mutations on CHO1 mRNA decay
Wild type (WT, W303-1B), cki1Δ (KS105), eki1Δ (KS101), and cki1Δ eki1Δ (KS106) mutant cells were grown to the exponential phase (1×10⁷ cells/ml) of growth. Following the arrest of transcription, CHO1 mRNA decay was quantified as described in the legend to Fig. 2. The figure shows a plot of the log of the relative amount of CHO1 to PGK1 mRNAs versus time. The lines drawn were the result of a least-squares analysis of the data. The data shown in the figure are representative of three independent experiments. Half-life values are presented in Table 3.
FIGURE 4
FIGURE 4. Effects of the eki1Δ, ect1Δ, and ept1Δ mutations on CHO1 mRNA decay
Wild type (WT, W303-1B), eki1Δ (KS101), ect1Δ (HCY3), and ept1Δ (HCY4) mutant cells were grown to the exponential phase (1×10⁷ cells/ml) of growth. Following the arrest of transcription, CHO1 mRNA decay was quantified as described in the legend to Fig. 2. The figure shows a plot of the log of the relative amount of CHO1 to PGK1 mRNAs versus time. The lines drawn were the result of a least-squares analysis of the data. The data shown in the figure are representative of three independent experiments. Half-life values are presented in Table 3.
FIGURE 5
FIGURE 5. Effects of Kennedy pathway mutations on the levels of CHO1 mRNA and PS synthase protein
Wild type (WT, W303-1B), cki1Δ (KS105), eki1Δ (KS101), cki1Δ eki1Δ (KS106), ect1Δ (HCY3), and ept1Δ (HCY4) mutant cells were grown to the exponential phase (1×10⁷ cells/ml) of growth. A, the abundance of CHO1 mRNA was determined with 10 µg of total RNA by Northern blot analysis. The relative amounts of CHO1 and PGK1 mRNAs from wild type and mutant cells were determined by ImageQuant analysis of the data. The relative amount of CHO1 to PGK1 mRNA in wild type cells was arbitrarily set at 1. B, the total membrane fraction (12.5 µg of protein) was subjected to immunoblot analysis using a 1:500 dilution of anti-PS synthase antibodies. The relative amounts of the PS synthase protein from wild type and mutant cells were determined by ImageQuant analysis of the data. The amount of PS synthase protein found in wild type cells was arbitrarily set at 1. The data shown in panels A and B are the average of three experiments ± S.D.
FIGURE 6
FIGURE 6. Effect of the EKI1 gene on CHO1 mRNA decay
Wild type (WT, W303-1B), eki1Δ (KS101 containing plasmid YEp352), eki1Δ/EKI1 (KS101 containing plasmid pHS9), and eki1Δ (HCY5) mutant cells were grown to the exponential phase (1×10⁷ cells/ml) of growth. Following the arrest of transcription, CHO1 mRNA decay was quantified as described in the legend to Fig. 2. The figure shows a plot of the log of the relative amount of CHO1 to PGK1 mRNAs versus time. The lines drawn were the result of a least-squares analysis of the data. The data shown in the figure are representative of three independent experiments. Half-life values are presented in Table 3.
FIGURE 7
FIGURE 7. Effect of respiratory deficiency on CHO1 mRNA decay
Wild type (WT, W303-1B), rho (MGY100), and rho° (W303 [rho°]) mutant cells were grown to the exponential phase (1×10⁷ cells/ml) of growth. Following the arrest of transcription, CHO1 mRNA decay was quantified as described in the legend to Fig. 2. The figure shows a plot of the log of the relative amount of CHO1 to PGK1 mRNAs versus time. The lines drawn were the result of a least-squares analysis of the data. The data shown in the figure are representative of three independent experiments. Half-life values are presented in Table 3.
FIGURE 8
FIGURE 8. Effects of KCN on CHO1 mRNA decay
Effects of KCN on CHO1 mRNA decay. Wild type (W303-1B) cells were grown to the exponential phase (1×10⁷ cells/ml) of growth in the absence and presence of the indicated concentrations of KCN. Following the arrest of transcription, CHO1 mRNA decay was quantified as described in the legend to Fig. 2. The figure shows a plot of the log of the relative amount of CHO1 to PGK1 mRNAs versus time. The lines drawn were the result of a least-squares analysis of the data. The data shown in the figure are representative of three independent experiments. Half-life values are presented in Table 3.
FIGURE 9
FIGURE 9. Effect of the cox4Δ mutation on CHO1 mRNA decay
Wild type (WT, W303-1B) and cox4Δ (WD1) mutant cells were grown to the exponential phase (1×10⁷ cells/ml) of growth. Following the arrest of transcription, CHO1 mRNA decay was quantified as described in the legend to Fig. 2. The figure shows a plot of the log of the relative amount of CHO1 to PGK1 mRNAs versus time. The lines drawn were the result of a least-squares analysis of the data. The data shown in the figure are representative of three independent experiments. Half-life values are presented in Table 3.
FIGURE 10
FIGURE 10. Effects of respiratory deficiency on the levels of CHO1 mRNA, PS synthase protein, PS synthase activity, and the synthesis of PS in vivo
Wild type (WT, W303-1B) and rho (HCY8) mutant cells were grown to the exponential phase (1×10⁷ cells/ml) of growth. A, the abundance of CHO1 mRNA was determined with 10 µg of total RNA by Northern blot analysis. The relative amounts of CHO1 and PGK1 mRNAs from wild type and mutant cells were determined by ImageQuant analysis of the data. The relative amount of CHO1 to PGK1 mRNA in wild type cells was arbitrarily set at 1. B, the total membrane fraction (12.5 µg of protein) was subjected to immunoblot analysis using a 1:500 dilution of anti-PS synthase antibodies. The relative amounts of the PS synthase protein from wild type and mutant cells were determined by ImageQuant analysis of the data. The amount of PS synthase protein found in wild type cells was arbitrarily set at 1. C, the total membrane fraction was isolated and used for the assay of PS synthase activity. D, cells were incubated with [14C]serine for 30 min. Phospholipids were extracted and analyzed by two-dimensional TLC. The data shown in panels A–D are the average of three experiments ± S.D.
FIGURE 11
FIGURE 11. Effects of the rho mutation on the levels of phospholipid synthesis enzyme activities
Wild type (WT, W303-1B) and rho (HCY8) mutant cells were grown to the exponential phase (1×10⁷ cells/ml) of growth. The total membrane fraction was isolated and used for the assay of CDP-DAG synthase (CDS), PS synthase (PSS), PS decarboxylase (PSD), PE methyltransferase (PEMT), phospholipid methyltransferase (PLMT), and PI synthase (PIS). The cell extract was used for the assay of choline kinase (CK) activity. The specific activities (nmol/min/mg) of these enzymes from wild type cells were 0.92 ± 0.04, 2.2 ± 0.03, 0.41 ± 0.02, 0.4 ± 0.05, 0.64 ± 0.01, 2.5 ± 0.14, and 4.5 ± 0.14. Each data point represents the average of triplicate enzyme determinations from two independent experiments ± S.D.

Similar articles

Cited by

References

    1. Letts VA, Klig LS, Bae-Lee M, Carman GM, Henry SA. Proc.Natl.Acad.Sci.USA. 1983;80:7279–7283. - PMC - PubMed
    1. Nikawa J, Tsukagoshi Y, Kodaki T, Yamashita S. Eur.J.Biochem. 1987;167:7–12. - PubMed
    1. Kiyono K, Miura K, Kushima Y, Hikiji T, Fukushima M, Shibuya I, Ohta A. J.Biochem. 1987;102:1089–1100. - PubMed
    1. Carman GM, Zeimetz GM. J.Biol.Chem. 1996;271:13293–13296. - PubMed
    1. Carman GM, Henry SA. Prog.Lipid Res. 1999;38:361–399. - PubMed

Publication types

MeSH terms

Substances