. 2007 Nov 1;584(Pt 3):789-800.
doi: 10.1113/jphysiol.2007.142794. Epub 2007 Aug 30.

Neurosteroid migration to intracellular compartments reduces steroid concentration in the membrane and diminishes GABA-A receptor potentiation

Affiliations

Neurosteroid migration to intracellular compartments reduces steroid concentration in the membrane and diminishes GABA-A receptor potentiation

Ping Li et al. J Physiol. .

Abstract

Neurosteroids are potent modulators of GABA-A receptors. We have examined the time course of development of potentiation of alpha1beta2gamma2L GABA-A receptors during coapplication of GABA and an endogenous neurosteroid (3alpha,5alpha)-3-hydroxypregnan-20-one (3alpha5alphaP). The simultaneous application of 3alpha5alphaP with 5 microm GABA resulted in a biphasic rising phase of current with time constants of 50-60 ms for the rapid phase and 0.3-3 s for the slow phase. The properties of the rapid phase were similar at all steroid concentrations but the time constant of the slower phase became successively shorter as the steroid concentration was increased. Potentiation developed very rapidly (tau = 130 ms) when cells were preincubated with 300 nm 3alpha5alphaP before application of GABA + 3alpha5alphaP, and in outside-out patch recordings, suggesting that steroid diffusion to intracellular compartments competes with receptor potentiation by depleting the cell membrane of steroid. Very low steroid concentrations (3-5 nm) potentiated GABA responses but the effects took minutes to develop. Intracellular accumulation of a fluorescent steroid analogue followed a similar time course, suggesting that slow potentiation results from slow accumulation within plasma membrane rather than indirect effects, such as activation of second messenger systems. In cell-attached single-channel recordings, where 3alpha5alphaP is normally applied through the pipette solution, addition of steroid to the bath solution dramatically shifted the steroid potentiation concentration-effect curve to lower steroid concentrations. We propose that bath-supplied steroid compensates for the diffusion of pipette-supplied steroid out of the patch to the rest of the cell membrane and/or intracellular compartments. The findings suggest that previous studies overestimate the minimum concentration of steroid capable of potentiating GABA actions at GABA-A receptors. The results have implications for the physiological role of endogenous neurosteroids.


Figures

Figure 5
Figure 5
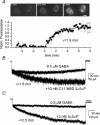
Direct evidence for compartmentalization of steroid A, images from an experiment in which 0.5 μm C11-NBD 3α5αP was rapidly applied by perfusion to an untransfected HEK cell for 2 s (beginning at time 0), followed by return to static bath. Images were acquired every 200 ms, and representative time points are shown in the upper left of each image. Steroid accumulated most prominently initially around the periphery of the cell, followed by slower intracellular accumulation. The cell diameter was 22.1 μm. B, time course of fluorescence accumulation from the cell in panel A. A curved peri-membrane region of interest 8 μm long and 1.4 μm wide was used to quantify peri-membrane fluorescence. A circular region of interest of 2.9 μm diameter placed near the cell centre was used to quantify intracellular fluorescence. The bar denotes the application of C11-NBD 3α5αP to the cell.
Figure 4
Figure 4
Accumulation of fluorescent steroid follows the time course of potentiation A, fluorescence images from untransfected HEK cells at time zero (before application of fluorescent steroid analogue; left panel), 30 s after addition of 5 nm C11-NBD 3α5αP (centre) and 5 min after continuous exposure (right). Scale bar indicates 20 μm. Lower panel gives the summary of the change in fluorescence from 3 independent fields of cells imaged every 12 s. Points indicate mean ± standard error of the mean. The increase in fluorescence was fitted with an exponential function with a time constant of 1.9 min (continuous line). B, macroscopic responses from a HEK cell expressing α1β2γ2L GABA-A receptors. The cell was exposed to 0.5 μm GABA or GABA + 10 nm C11-NBD 3α5αP. The application duration was 6 min. The slow phase in the GABA + steroid curve was fitted with an exponential function with a time constant of 1.6 min. Application of 10 nm C11-NBD 3α5αP alone did not result in appreciable current responses even after 5 min applications (not shown). C, macroscopic responses from a HEK cell expressing α1β2γ2L GABA-A receptors. The cell was exposed to 0.5 μm GABA or GABA + 3 nm 3α5αP. The application duration was 6 min. The slow phase in the GABA + steroid curve was fitted with an exponential function with a time constant of 2.5 min. Application of 3 nm 3α5αP alone did not result in appreciable current responses even after 5 min applications (not shown).
Figure 1
Figure 1
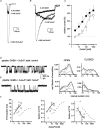
The kinetics of current development during channel potentiation by 3α5αP A, the rate of current development depends on the concentration of 3α5αP. Representative macroscopic current traces from a HEK cell expressing α1β2γ2L GABA-A receptors. The receptors were activated by 8 s applications of 5 μm GABA or GABA plus 50–1000 nm 3α5αP. Successive applications were separated by 60 s washout periods. The increase in the steroid concentration led to an increase in the peak response and a faster rise time. B, the area shown by a dotted circle in A is shown at a higher time resolution. In most cells, the increase in the concentration of steroid did not affect the time course or amplitude of the first, faster component of current development.
Figure 2
Figure 2
The slow phase is removed by preincubation with steroid and patch excision A, preincubation with 3α5αP modifies the shape of current development for subsequent application of GABA + steroid. A cell exposed to 5 μm GABA and 300 nm 3α5αP shows the characteristic slow rise phase (left panel). In the same cell, preincubation with 300 nm 3α5αP for 60 s resulted in the loss of the slow rising phase (right panel), presumably because of filling of compartments and/or sites to which the steroid may bind. B, an outside-out patch was exposed to 5 μm GABA alone or GABA in the presence of 100–1000 nm 3α5αP. The applications lasted for 4 s, and were separated by 30 s washout periods. The presence of steroid led to an increase in peak current without introducing the second, slow rising phase. The time constants for the rising phase are as follows: 5 μm GABA, 73 ms; GABA + 100 nm 3α5αP, 88 ms; GABA + 300 nm 3α5αP, 77 ms; GABA + 1000 nm 3α5αP, 74 ms.
Figure 3
Figure 3
Steroid concentration–effect properties depend on equilibration of the cell with steroid A, whole-cell currents were elicited by 5 μm GABA alone or GABA in the presence of 3 nm or 1000 nm 3α5αP. The drug applications were 2 s in duration, and separated from successive recordings with 30 s washout periods. Exposure to 3 nm 3α5αP had no discernible effect on current response. B, whole-cell currents were elicited by 5 μm GABA alone or GABA in the presence of 3 nm or 1000 nm 3α5αP. The drug applications were 20 s in duration, and separated from successive recordings with 90 s washout periods. Exposure to 3 nm 3α5αP roughly doubled the peak current. C, steroid potentiation concentration–effect curves at 5 μm GABA were measured using 2 s (○) or 20 s (█) drug applications. Each symbol represents the mean value from data from 3 to 5 cells. The curves were fitted to: relative current = maximal potentiation/(1 + (EC50/[GABA])nH). Offset was fixed at 100%. The best-fit parameters for 2 s applications are: maximal potentiation = 410 ± 48%, EC50= 100 ± 44 nm, nH= 1.14 ± 0.39. The best-fit parameters for 20 s applications are: maximal potentiation = 472 ± 10%, EC50= 26 ± 3 nm, nH= 0.63 ± 0.04. The difference in potentiation by 1000 nm 3α5αP is not significantly different for 2 s versus 20 s applications. D, a sample single-channel cluster obtained with 50 μm GABA and 10 nm 3α5αP in the pipette. The open and closed time histograms were fitted to three exponentials. The open times were: 0.42 ms (24%), 5.7 ms (57%) and 9.0 ms (20%). The closed times were: 0.15 ms (38%), 1.7 ms (28%) and 14.7 ms (34%). E, a sample single-channel cluster obtained with 50 μm GABA and 10 nm 3α5αP in the pipette, and 10 nm 3α5αP in the bath solution. The open times were: 0.55 ms (31%), 8.3 ms (24%) and 16.4 ms (45%). The closed times were: 0.15 ms (74%), 1.5 ms (23%) and 20.0 ms (3%). F, steroid concentration–effect curves for the duration of OT3, fraction of OT3 and fraction of CT3. The receptors were activated by 50 μm GABA. The control data (shown with the dashed line) are from Akk et al. (2005), and apply to data obtained with steroid in the pipette but not in the bath. Each symbol stands for data from one patch obtained under the condition where steroid, at the same concentration as in the pipette solution, was also present in the bath solution. The curves were fitted using the equation Y([steroid]) =Y0+ (YmaxY0)[steroid]/([steroid]+ EC50). The EC50 values for the control data (steroid only in the pipette) are: 66 nm (OT3 duration), 119 nm (fraction of OT3) and 94 nm (fraction of CT3). The EC50 values for the data obtained with steroid in the pipettete and the bath solutions are: 3.8 ± 2.5 nm (OT3 duration), 2.6 ± 2.8 nm (fraction of OT3) and 3.5 ± 6.5 nm (fraction of CT3).

Similar articles

Cited by

References

    1. Agis-Balboa RC, Pinna G, Zhubi A, Maloku E, Veldic M, Costa E, Guidotti A. Characterization of brain neurons that express enzymes mediating neurosteroid biosynthesis. Proc Natl Acad Sci U S A. 2006;103:14602–14607. - PMC - PubMed
    1. Akk G. Contributions of the non-α subunit residues (loop D) to agonist binding and channel gating in the muscle nicotinic acetylcholine receptor. J Physiol. 2002;544:695–705. - PMC - PubMed
    1. Akk G, Bracamontes JR, Covey DF, Evers A, Dao T, Steinbach JH. Neuroactive steroids have multiple actions to potentiate GABAA receptors. J Physiol. 2004;558:59–74. - PMC - PubMed
    1. Akk G, Bracamontes J, Steinbach JH. Pregnenolone sulfate block of GABAA receptors: mechanism and involvement of a residue in the M2 region of the α subunit. J Physiol. 2001;532:673–684. - PMC - PubMed
    1. Akk G, Li P, Manion BD, Evers AS, Steinbach JH. Ethanol modulates the interaction of the endogenous neurosteroid allopregnanolone with the α1β2γ2L GABAA receptor. Mol Pharmacol. 2007;71:461–472. - PubMed

Publication types