. 2007 Oct 15;584(Pt 2):543-63.
doi: 10.1113/jphysiol.2007.141267. Epub 2007 Aug 30.

Neuron type-specific effects of brain-derived neurotrophic factor in rat superficial dorsal horn and their relevance to 'central sensitization'

Affiliations

Neuron type-specific effects of brain-derived neurotrophic factor in rat superficial dorsal horn and their relevance to 'central sensitization'

Van B Lu et al. J Physiol. .

Abstract

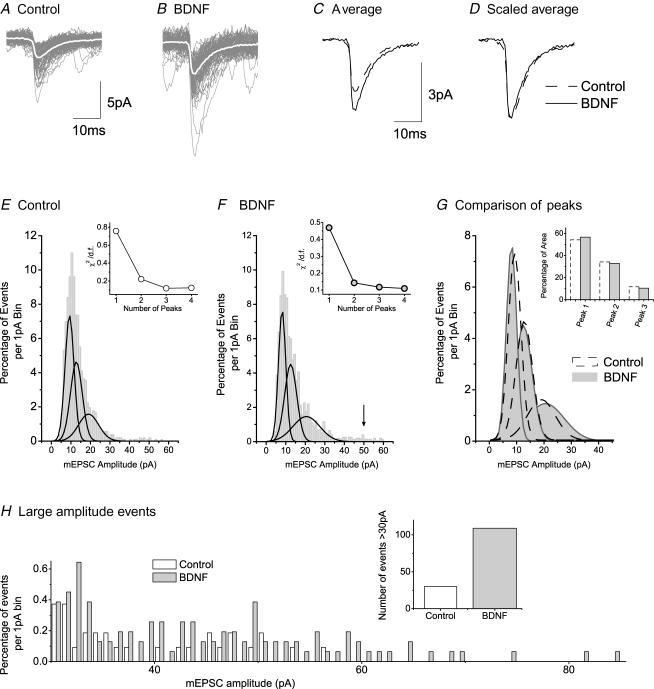
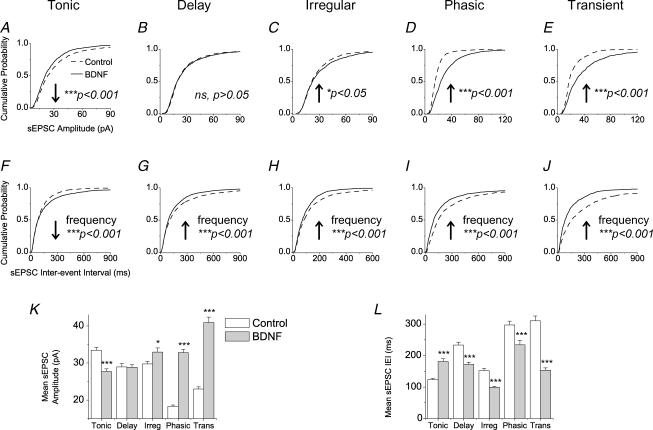
Chronic constriction injury (CCI) of the rat sciatic nerve increases the excitability of the spinal dorsal horn. This 'central sensitization' leads to pain behaviours analogous to human neuropathic pain. We have established that CCI increases excitatory synaptic drive to putative excitatory, 'delay' firing neurons in the substantia gelatinosa but attenuates that to putative inhibitory, 'tonic' firing neurons. Here, we use a defined-medium organotypic culture (DMOTC) system to investigate the long-term actions of brain-derived neurotrophic factor (BDNF) as a possible instigator of these changes. The age of the cultures and their 5-6 day exposure to BDNF paralleled the protocol used for CCI in vivo. Effects of BDNF (200 ng ml(-1)) in DMOTC were reminiscent of those seen with CCI in vivo. These included decreased synaptic drive to 'tonic' neurons and increased synaptic drive to 'delay' neurons with only small effects on their membrane excitability. Actions of BDNF on 'delay' neurons were exclusively presynaptic and involved increased mEPSC frequency and amplitude without changes in the function of postsynaptic AMPA receptors. By contrast, BDNF exerted both pre- and postsynaptic actions on 'tonic' cells; mEPSC frequency and amplitude were decreased and the decay time constant reduced by 35%. These selective and differential actions of BDNF on excitatory and inhibitory neurons contributed to a global increase in dorsal horn network excitability as assessed by the amplitude of depolarization-induced increases in intracellular Ca(2+). Such changes and their underlying cellular mechanisms are likely to contribute to CCI-induced 'central sensitization' and hence to the onset of neuropathic pain.


Figures

Figure 1
Figure 1. Time course of BDNF treatment parallels time course of nerve injury in vivo in a neuropathic pain model (CCI)
Timeline indicated for long-term BDNF DMOTC experiments, shown above, and previous CCI experiments (Balasubramanyan et al. 2006), shown below. Time indicated in postnatal days. The duration of treatment (which lasted 5–6 days) was chosen to correlate with reports of prolonged BDNF release following nerve injury (see Introduction). BDNF treatment was started either 15 or 21 days after the cultures were established and experiments were conducted after the treatment period.
Figure 8
Figure 8. Analysis of the effects of BDNF on mEPSCs of delay neurons
A, superimposed recordings of 3 min of mEPSC activity in a control delay neuron; average of events presented as superimposed white trace. B, similar superimposed recordings from a delay neuron in a BDNF-treated culture. C, averaged events from the neurons illustrated in A and B. D, averaged events normalized to control size. Note no change in the rate of decay of current. E, distribution histogram (1 pA bins) for amplitudes of 1074 mEPSCs from control delay neurons. Fit of the data to three Gaussian distributions represented by black lines. F, similar histogram and fit to three Gaussian functions for 1554 mEPSCs from BDNF treated neurons; arrow points out small number of very large events that appear in BDNF. Insets in E and F, graphs to show effect of number of Gaussian fits (peaks) on the value of χ2 divided by the number of degrees of freedom. G, superimposition of the three Gaussian peaks obtained in E with those obtained in F. Inset, comparison of area under curves for the three peaks (normalized to total area under peaks). H, data for control and BDNF mEPSCs > 30 pA replotted and compared on the same axes. Inset, number of mEPSC events larger than 30 pA.
Figure 7
Figure 7. Analysis of the effects of BDNF on mEPSCs of tonic neurons
A, superimposed recordings of 3 min of mEPSC activity in a control tonic neuron; average of events presented as superimposed white trace. B, similar superimposed recordings from a tonic neuron in a BDNF-treated culture. C, averaged events from the neurons illustrated in A and B. D, averaged events normalized to control size. Note marked increased rate of decay of current. E, distribution histogram (1 pA bins) for amplitudes of 1100 mEPSCs from control tonic neurons. Fit of the data to three Gaussian distributions represented by continuous lines. F, similar histogram and fit to three Gaussian functions for 877 mEPSCs from BDNF-treated neurons. Insets in E and F, graphs to show effect of number of Gaussian fits (peaks) on the value of χ2 divided by the number of degrees of freedom. G, superimposition of the three Gaussian peaks obtained in E with those obtained in F. HJ, modelled mEPSCs to represent the three peak Gaussian amplitudes obtained in E and F; dashed lines are for control events (from E), grey lines are for events in BDNF (from F) and dotted lines illustrate effect of a 35% reduction of τ2 on the control events.
Figure 2
Figure 2. Minimal changes in the proportion of each characterized neuronal cell type within the dorsal horn following BDNF treatment
A, sample current-clamp recordings displaying different discharge firing patterns used to classify neurons within the dorsal horn. Three different recording traces at different current intensities are overlapped for each cell type. Membrane potential was set to −60 mV prior to injection of current pulses. Refer to text for details of characteristic features of each cell type. B and C, pie graphs showing percentage of each neuronal cell type identified in recordings from control DMOTC slices (n= 120) and BDNF treated DMOTC slices (n= 112). The only significant shift in the population was in the transient cell type group (χ2 test, *P < 0.05).
Figure 9
Figure 9. Effect of BDNF on spontaneous activity of tonic and delay neurons
Spontaneous activity was measured as the number of depolarizations or action potential discharges at resting membrane potential in current-clamp mode. The mean number of spontaneous excitatory postsynaptic potentials (sEPSPs) and spontaneous action potentials generated from sEPSPs are shown for tonic (A and B, respectively) and delay neurons (C and D, respectively). For tonic neurons, n= 36 for controls, n= 15 for BDNF. For delay neurons, n= 35 for controls, n= 27 for BDNF. E and F, sample 2 min recording of spontaneous activity from a control (E) and BDNF-treated (F) delay neuron. Lower panels show on an expanded time scale a large sEPSP generating an action potential. Note under long-term BDNF treatment conditions, the probability of a large sEPSP generating a burst of action potentials is greater. G, percentage of cells in the tonic and delay group firing a burst of action potentials. White bars indicate controls and grey bars indicate BDNF-treated neurons.
Figure 3
Figure 3. Minimal effects of BDNF membrane excitability
Membrane excitability was measured as the cumulative latency of action potential discharges in response to a depolarizing current ramp from −60 mV. Top panels show sample records of a typical response of tonic, delay, irregular, phasic and transient cells to a 60 pA s−1 current ramp injection for 1.5 s. With the exception of transient cells, all cell types discharged ≥ 3 spikes in response to the current ramp. Lower panels are graphs of cumulative latency against spike number for each cell type. Not all cells produced the same number of action potential spikes during ramps. For example in A, of the 27 tonic cells examined only 5 of them fired 15 action potentials. The mean cumulative latencies for each spike number therefore have different sample sizes. A, for tonic cells, n= 5–27 for controls, n= 11–22 for BDNF. B, for delay cells, n= 6–27 for controls, n= 10–32 for BDNF. C, for irregular cells, n= 5–18 for controls, n= 5–19 for BDNF. D, for phasic cells, n= 5–7 for controls, n= 5–9 for BDNF. E, for transient cells, n= 3 for controls, n= 4 for BDNF. The only increase in excitability after BDNF treatment was observed in delay cells (t test, *P < 0.05). In some cases, error bars indicating s.e.m. are smaller than the symbols used to plot the data.
Figure 6
Figure 6. Effects of BDNF on the action potential-dependent (TTX-sensitive) sEPSCs population
AB, comparison of sEPSCs to mEPSCs for controls. Comparison of mean amplitudes (A) and mean interevent intervals, IEI (B) are shown. Cross-hatched bars indicate values for sEPSCs and horizontal lined bars indicate values for mEPSCs. C, the percentage of TTX-sensitive sEPSCs was calculated as the number of mEPSCs subtracted from the total number of sEPSCs over the total sEPSCs for each cell. The mean percentages are shown for controls, white bars, and the BDNF-treated group, grey bars. For Student's unpaired t test, *P < 0.05, ***P < 0.001. Error bars indicate s.e.m.D and E, sample recording traces from tonic (D) and delay (E) cells under control and long-term BDNF exposure conditions. Sample mEPSC recording traces were from the same cell represented in the above sample sEPSC recording trace.
Figure 4
Figure 4. Effects of BDNF on amplitude and interevent interval of spontaneous excitatory postsynaptic currents (sEPSCs)
AE, cumulative probability plots for sEPSC amplitude. The first 50 events following the 1st minute of recordings from each cell were pooled in order to construct cumulative distribution plots, except for phasic and transient cells where the first 200 or 100 events following the 1st minute of recording were taken, respectively. A, tonic cells; 1450 events from control DMOTC slices, 1950 events from BDNF-treated DMOTC slices. B, delay cells; 1900 events for controls, 1100 events for BDNF. C, irregular cells; 1350 events for controls, 1100 events for BDNF. D, phasic cells; 1356 events for controls, 1670 events for BDNF. E, transient cells; 800 events for controls, 800 events for BDNF. An equal number of BDNF-treated transient cells as controls were chosen at random to analyse sEPSC events. P values derived from the KS test indicated on graphs. FJ, cumulative probability plots for sEPSC interevent interval (IEI). P values derived from the KS test indicated on graphs. K and L, effects of BDNF on mean amplitude (K) and IEI (L) of sEPSC events. The same events used to construct cumulative probability plots were used, so the same n values apply. For Student's unpaired t test, *P < 0.05, ***P < 0.001. Error bars indicate s.e.m.
Figure 5
Figure 5. Effects of BDNF on amplitude and interevent interval of miniature excitatory postsynaptic currents (mEPSCs)
AE, cumulative probability plots for mEPSC amplitude. The first 50 events following the 1st minute of recordings from each cell were pooled in order to construct cumulative distribution plots. A, tonic cells; 1100 events from control DMOTC slices, 877 events from BDNF-treated DMOTC slices. B, delay cells; 1074 events for controls, 1554 events for BDNF. C, irregular cells; 700 events for controls, 800 events for BDNF. D, phasic cells; 303 events for controls, 300 events for BDNF. E, transient cells; 300 events for controls, 300 events for BDNF. An equal number of BDNF-treated transient cells as controls were chosen at random to analyse mEPSC events. P values derived from the KS test indicated on graphs. FJ, cumulative probability plots for mEPSC interevent interval (IEI). P values derived from the KS test indicated on graphs. K and L, effects of BDNF on mean amplitude (K) and IEI (L) of mEPSC events. The same events used to construct cumulative probability plots were used, so the same n values apply. For Student's unpaired t test, *P < 0.05, ***P < 0.001. Error bars indicate s.e.m.
Figure 10
Figure 10. Enhanced K+-induced Ca2+ rise in BDNF-treated DMOTC slices
AB, sample fluorescent Ca2+ intensity traces during a 90 s, 20 mm K+ challenge for a cell in a control DMOTC slice (A), and a BDNF-treated DMOTC slice (B). C and D, sample fluorescence images (512 × 512 pixels) of the dorsal region of a control slice (C) and a BDNF-treated DMOTC slice (D), loaded with Fluo-4 AM, during a 20 mm K+ solution challenge. White scale bar is 50 μm. E, comparison of Ca2+ fluorescence signal amplitude over a range of high K+ solutions tested. Amplitude of the signal was measured from baseline to peak of each trace recorded from cells in control and BDNF-treated DMOTC slices (n= 30 cells for control, n= 41 cells for BDNF). Scaling is in arbitrary units (a.u.) F, comparison of area under the Ca2+ fluorescence signal traces over a range of high K+ solutions in control and BDNF-treated DMOTC slices. At all concentrations tested, both area and amplitude of the Ca2+ signal were significantly larger in BDNF-treated cells (t test; *P < 0.05; ***P < 0.001). Error bars indicate s.e.m.G and H, sample baseline recordings from four cells in the same control DMOTC slice (G) and a BDNF-treated DMOTC slice (H). Dots with dashed lines indicate synchronous oscillations in Ca2+.

Similar articles

Cited by

References

    1. Alvarez FJ, Villalba RM, Zerda R, Schneider SP. Vesicular glutamate transporters in the spinal cord, with special reference to sensory primary afferent synapses. J Comp Neurol. 2004;472:257–280. - PubMed
    1. Apfel SC, Wright DE, Wiideman AM, Dormia C, Snider WD, Kessler JA. Nerve growth factor regulates the expression of brain-derived neurotrophic factor mRNA in the peripheral nervous system. Mol Cell Neurosci. 1996;7:134–142. - PubMed
    1. Baba H, Doubell TP, Woolf CJ. Peripheral inflammation facilitates Aβ fiber-mediated synaptic input to the substantia gelatinosa of the adult rat spinal cord. J Neurosci. 1999;19:859–867. - PMC - PubMed
    1. Baba H, Ji RR, Kohno T, Moore KA, Ataka T, Wakai A, Okamoto M, Woolf CJ. Removal of GABAergic inhibition facilitates polysynaptic A fiber-mediated excitatory transmission to the superficial spinal dorsal horn. Mol Cell Neurosci. 2003;24:818–830. - PubMed
    1. Bailey AL, Ribeiro-da-Silva A. Transient loss of terminals from non-peptidergic nociceptive fibers in the substantia gelatinosa of spinal cord following chronic constriction injury of the sciatic nerve. Neuroscience. 2006;138:675–690. - PubMed

Publication types

MeSH terms

Substances

LinkOut - more resources