

Critique of early models of the demographic impact of HIV/AIDS in sub-Saharan Africa based on contemporary empirical data from Zimbabwe
- PMID: 17761795
- PMCID: PMC1961581
- DOI: 10.1073/pnas.0611540104
Critique of early models of the demographic impact of HIV/AIDS in sub-Saharan Africa based on contemporary empirical data from Zimbabwe
Abstract
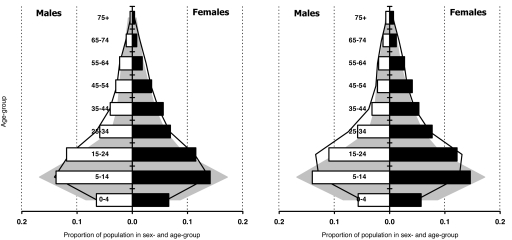
Early mathematical models varied in their predictions of the impact of HIV/AIDS on population growth from minimal impact to reductions in growth, in pessimistic scenarios, from positive to negative values over a period of 25 years. Models predicting negative rates of natural increase forecast little effect on the dependency ratio. Twenty years later, HIV prevalence in small towns, estates, and rural villages in eastern Zimbabwe, has peaked within the intermediate range predicted by the early models, but the demographic impact has been more acute than was predicted. Despite concurrent declines in fertility, fueled in part by HIV infections (total fertility is now 8% lower than expected without an epidemic), and a doubling of the crude death rate because of HIV/AIDS, the rate of natural population increase between 1998 and 2005 remained positive in each socioeconomic stratum. In the worst-affected areas (towns with HIV prevalence of 33%), HIV/AIDS reduced growth by two-thirds from 2.9% to 1.0%. The dependency ratio fell from 1.21 at the onset of the HIV epidemic to 0.78, the impact of HIV-associated adult mortality being outweighed by fertility decline. With the benefit of hindsight, the more pessimistic early models overestimated the demographic impact of HIV epidemics by overextrapolating initial HIV growth rates or not allowing for heterogeneity in key parameters such as transmissibility and sexual risk behavior. Data collected since the late 1980s show that there was a mismatch between the observed growth in the HIV epidemic and assumptions made about viral transmission.
Conflict of interest statement
The authors declare no conflict of interest.
Figures
References
-
- Anderson RM, May RM, McLean AR. Nature. 1988;332:228–234. - PubMed
-
- Anderson RM, May RM, Boily M-C, Garnett GP, Rowley JT. Nature. 1991;352:581–589. - PubMed
-
- Bongaarts J. Stat Med. 1989;9:103–120. - PubMed
-
- United Nations and World Health Organization. The AIDS Epidemic and its Demographic Consequences: Proceedings of the United Nations/World Health Organization Workshop on Modelling the Demographic Impact of the AIDS Epidemic in Pattern II Countries–Progress to Date and Policies for the Future; United Nations, New York. 1991. pp. 1–140.
Publication types
MeSH terms
Grants and funding
LinkOut - more resources
Full Text Sources
Medical
