. 2007 Dec;9(12):2968-83.
doi: 10.1111/j.1462-5822.2007.01038.x. Epub 2007 Aug 30.

IFN-gamma amplifies NFkappaB-dependent Neisseria meningitidis invasion of epithelial cells via specific upregulation of CEA-related cell adhesion molecule 1

Affiliations
Free PMC article

IFN-gamma amplifies NFkappaB-dependent Neisseria meningitidis invasion of epithelial cells via specific upregulation of CEA-related cell adhesion molecule 1

Natalie J Griffiths et al. Cell Microbiol. 2007 Dec.
Free PMC article

Abstract

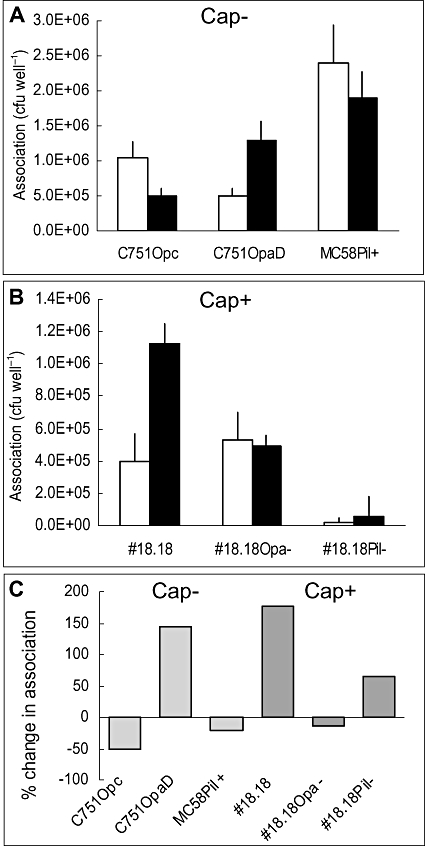
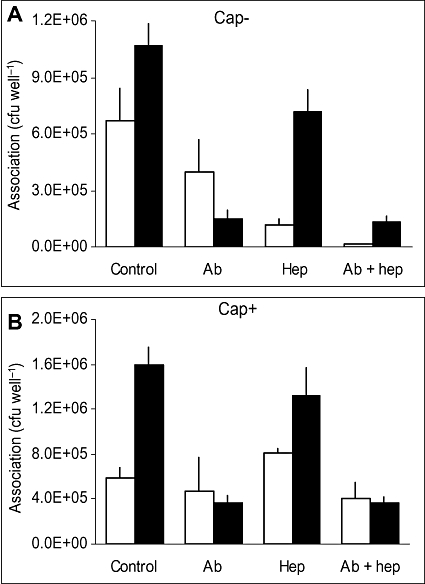
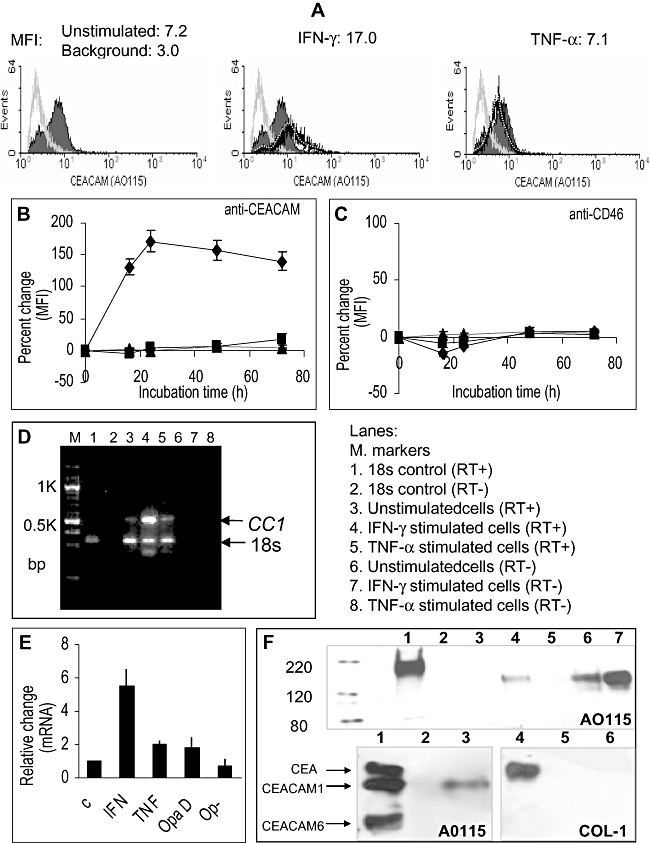
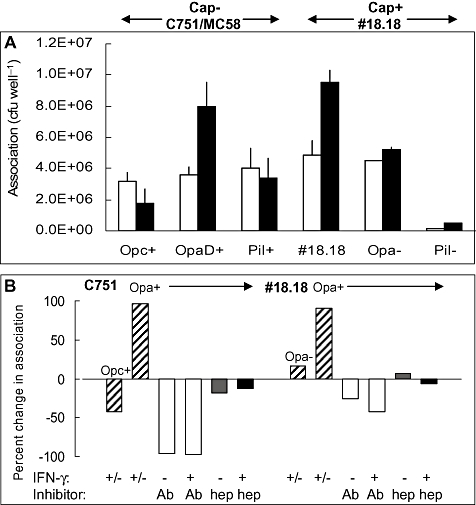
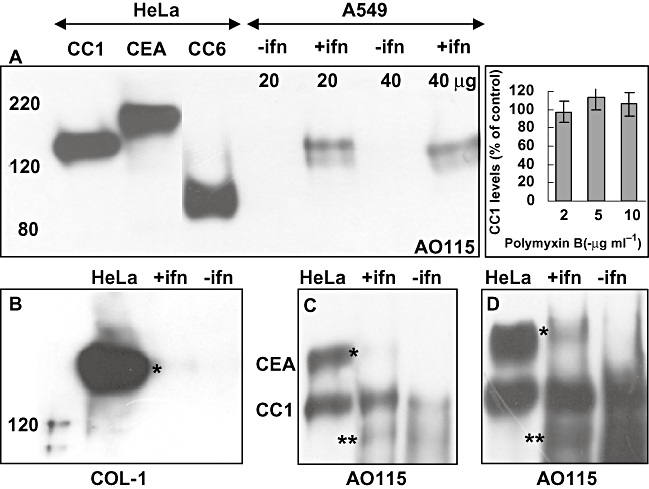
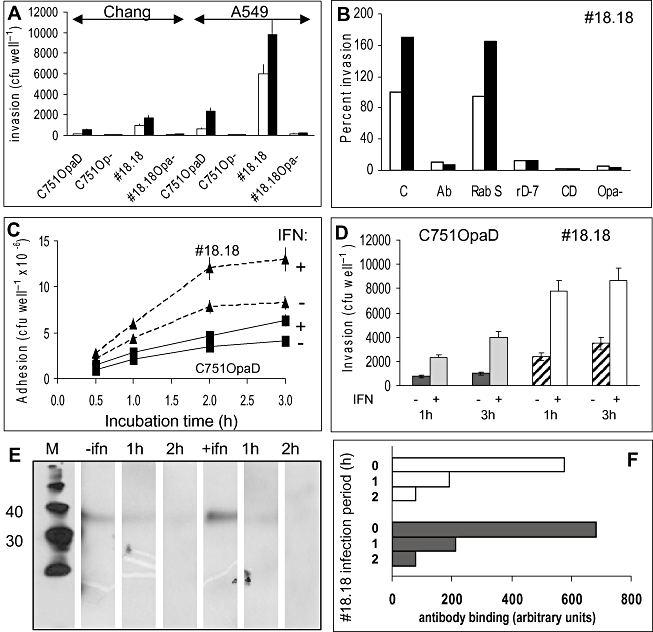
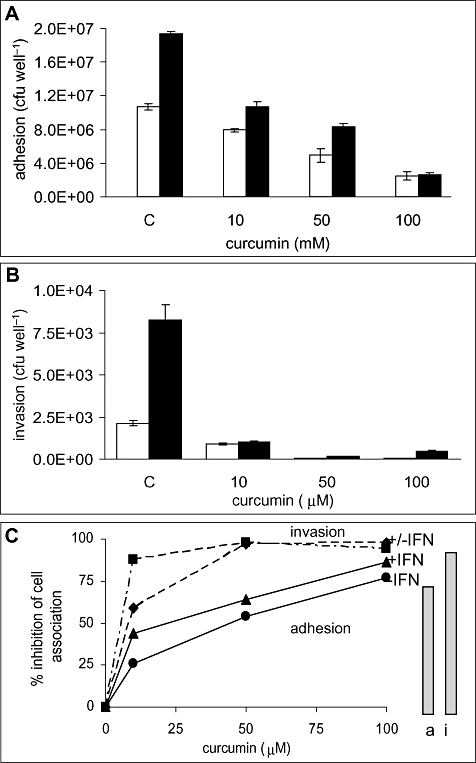
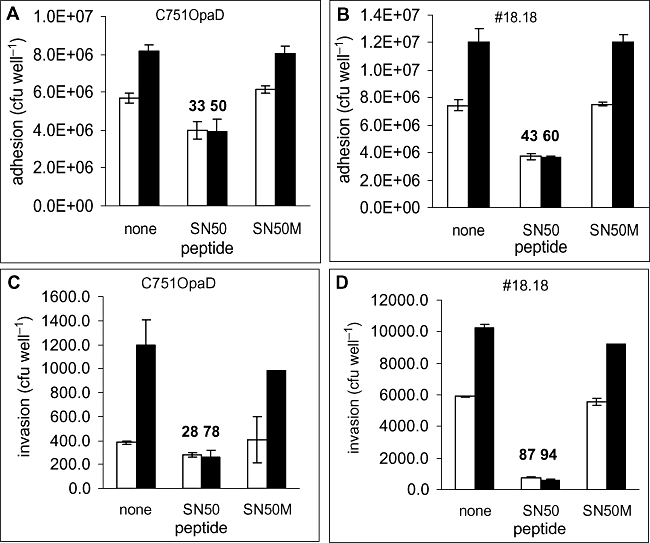
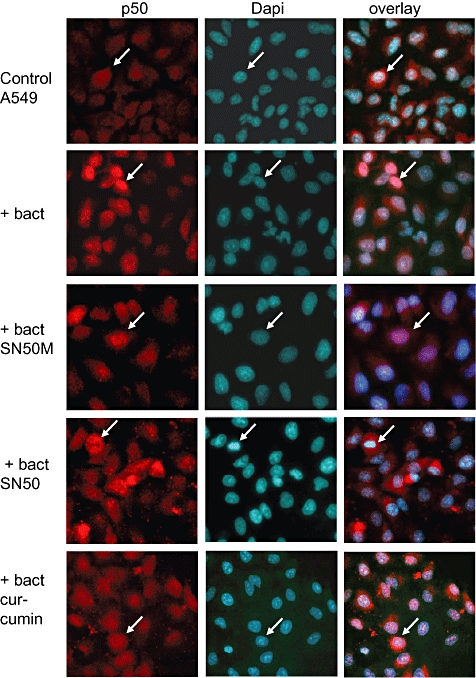
Temporal relationship between viral and bacterial infections has been observed, and may arise via the action of virus-induced inflammatory cytokines. These, by upregulating epithelial receptors targeted by bacteria, may encourage greater bacterial infiltration. In this study, human epithelial cells exposed to interferon-gamma but not tumour necrosis factor-alpha or interleukin 1-beta supported increased meningococcal adhesion and invasion. The increase was related to Opa but not Opc or pili adhesin expression. De novo synthesis of carcinoembryonic antigen-related cell adhesion molecule 1 (CEACAM1), a major Opa receptor, occurred in epithelial cells exposed to the cytokine, or when infected with Opa-expressing bacteria. Cell line-dependent differences in invasion that were observed could be correlated with CEACAM expression levels. There was also evidence for Opa/pili synergism leading to high levels of monolayer infiltration by capsulate bacteria. The use of nuclear factor-kappa B (NFkappaB) inhibitors, diferuloylmethane (curcumin) and SN50, abrogated bacterial infiltration of both untreated and interferon-gamma-treated cells. The studies demonstrate the importance of CEACAMs as mediators of increased cellular invasion under conditions of inflammation and bring to light the potential role of NFkappaB pathway in Opa-mediated invasion by meningococci. The data imply that cell-surface remodelling by virally induced cytokines could be one factor that increases host susceptibility to bacterial infection.


Figures

Fig. 1
Fig. 1
Increased association of Opa-expressing but not Opc- or pili-expressing bacteria with IFN-γ-stimulated Chang cells. Chang cells were treated with IFN-γ (filled columns) or left untreated (blank columns). The meningococcal phenotypes employed are described in Table 1. Three acapsulate (Cap) Nm isolates expressing either Opc, OpaD (strain C751) or pili (strain MC58) (A), or capsulate (Cap+) derivatives of MC58#18.18 with Opa and pili adhesins or those lacking Opa or pili (B), were used to infect confluent monolayers, and associated bacteria were quantified by viable count assays. All #18.18 derivatives expressed Opc and LPS of L3 immunotype.A and B. Means and SEs of representatives of several experiments are shown.C. Mean values of per cent change in association of the acapsulate and capsulate variants after IFN-γ treatment compiled from data of 3–4 independent experiments are shown; SEs were within 25% of the means. Per cent change: (test − control/control) × 100.
Fig. 2
Fig. 2
Assessment of the contribution of HSPGs and CEACAMs to increased Opa-dependent binding of IFN-γ-stimulated Chang cells. IFN-γ-treated cells (filled columns) and untreated cells (blank columns) were infected with acapsulate C751OpaD variant (A) or capsulate #18.18 (B) in the presence of 50 μg ml−1 heparin (hep), rabbit anti-CEACAM antibody AO115 (Ab) or a mixture of antibody and heparin (Ab + hep). AO115 reacts with CEA, CEACAM1 and CEACAM6. Normal rabbit serum used as a control in some tests showed no inhibition (not shown). Means and SEs of one representative of several experiments are shown.
Fig. 3
Fig. 3
Surface expression and de novo transcription of CEACAMs in Chang cells following cytokine stimulation and bacterial infection. Surface expression of CEACAMs on Chang cells was assessed by flow cytometry before and after cytokine stimulation using anti-CEACAM antibody AO115 that binds to multiple CEACAMs. Examples of histograms of CEACAM expression from one experiment are shown (A). CEACAM expression of unstimulated cells is shown in black (filled profile), that of stimulated cells in dotted white lines (traced on to black unfilled profile), and binding of the secondary antibody alone is shown in grey.B and C. Per cent change in the expression of CEACAM and CD46 receptors in response to various cytokines as determined by flow cytometry. AO115 was used to detect CEACAMs (B) and J4-48 for CD46 detection (C) in Chang cells exposed to IFN-γ (diamonds), TNF-α (squares) and IL-1β (triangles) over a 72 h period. Per cent change of MFI observed over untreated cells is shown. Data are means and SEs from three determinations. Note: A and B are separate experiments.D. Agarose gel profile showing the results of a typical semiquantitative RT-PCR of mRNA extracted from Chang cells illustrating the relative levels of 18s rRNA and ceacam1 mRNA present in unstimulated and cytokine-stimulated cells. Lane contents are shown on the right. RT, reverse transcriptase.E. The relative changes in ceacam1 mRNA in cytokine-stimulated Chang cells (24 h) or in cells infected with bacteria (3 h) were calculated after normalizing for 18s rRNA. Means and SEs of 2–4 experiments are shown.F. Western blots showing CEACAM proteins expressed in Chang cells.Top: proteins extracted from unstimulated Chang cells [lane 2 (10 μg), lane 3 (20 μg) and lane 5 (40 μg)] or those exposed to IFN-γ[lane 4 (20 μg) and lane 6 (40 μg)] were analysed by Western blotting using anti-CEACAM antibodies. AO115 binds to multiple CEACAMs but recognized a protein only in stimulated cells, which corresponded to the migration of CEACAM1. Control samples of transfected HeLa cells expressing distinct CEACAMs were used for comparison (lane 1: HeLa-CEA and lane 7: HeLa-CEACAM1; 4 μg total protein of each).Bottom: lanes 1–3: polyclonal AO115 and anti-CEA/CEACAM3 cross-reacting monoclonal antibody COL-1 detection of CEACAMs in HeLa and Chang extracts. Lanes 1 and 4 contain 4 μg each of HeLa-CEA, -CEACAM1 and -CEACAM6. Lanes 2 and 5 contain 60 μg of total protein extract from unstimulated Chang cells, and lanes 3 and 6 contain 60 μg protein from stimulated Chang cells. Data show very low levels of CEACAM1 in unstimulated Chang cells, and only CEACAM1 is upregulated after IFN-γ treatment.
Fig. 4
Fig. 4
Adhesins and receptors involved in the interactions of various Nm phenotypes with unstimulated and IFN-γ-stimulated A549 cells. A549 monolayers were treated with IFN-γ (filled columns) or left untreated (blank columns), and adhesion of acapsulate or capsulate bacterial phenotypes was determined by viable count assays. Means and SEs from one typical experiment are shown (A).B. Per cent change in association of the acapsulate and capsulate variants to cells after IFN-γ treatment compared with untreated cells (shown as ‘+/−’) compiled from data of 3–4 independent experiments (hatched columns). In addition, data are also shown for the inhibition of interactions of Opa+ phenotypes in the absence or presence of anti-CEACAM antibody and heparin for both untreated and IFN-γ-treated cells (details as in legend to Fig. 2). SEs were within 25% of mean values shown.
Fig. 5
Fig. 5
CEACAM protein expression in A549 before and after IFN-γ treatment. Extracts from transfected HeLa cells expressing CEACAM1 (CC1), CEA or CEACAM6 (CC6) were applied to individual wells as shown in A, and HeLa-CEA and -CEACAM1 mixtures were applied to single wells (lanes marked ‘HeLa’ in B–D) for comparison. A549 extracts (20–60 μg protein) were applied to individual wells as shown, and Western blots were developed using either AO115 to detect all CEACAMs expressed or COL-1 to detect CEA. Only CEACAM1 can be seen in A (20–40 μg loading) and only after IFN-γ treatment. On higher loading and further development, low levels of CEACAM1 were seen in unstimulated cells, and the protein band became more intense after the cytokine treatment (C). CEA was not detectable in unstimulated cells even on applying 60 μg of protein (D). After IFN-γ treatment, on higher loading a weak band can be seen with COL-1 (B). With 60 μg protein loading and much longer development, a band corresponding to CEA (*) can be seen more clearly (D). The bands shown by double asterisks are likely to be isoforms of CEACAM1. That CEACAM1 expression was not due to LPS contamination of IFN-γ preparations used, was demonstrated by incorporating increasing concentrations of polymyxin B (PB) to neutralize the effect of LPS (top right inset). Per cent CEACAM1 levels expressed were determined by densitometric analysis of CEACAM1 bands observed in the presence compared with the absence of PB.
Fig. 6
Fig. 6
Invasion of IFN-γ-treated and untreated cells by Opa-deficient and proficient meningococcal phenotypes.A. Comparison of acapsulate and capsulate bacterial ability to invade Chang and A549 cells pretreated with IFN-γ (filled columns) or left untreated (blank columns).B. Inhibition of cellular invasion by #18.18 in the presence of anti-CEACAM antibody A0115 (Ab), CEACAM binding recombinant peptide (rD-7) or cytochalasin D (CD). CD treatment was used to demonstrate that on inhibition of cytoskeletal function, which usually inhibits uptake, no bacteria survived gentamicin treatment. Thus, any survivors of gentamicin treatment reported here represent internalized bacteria. Invasion levels of #18.18Opa are shown for comparison.C. Effect of IFN-γ treatment on the rate of cellular adhesion and invasion by acapsulate (squares) and capsulate (triangles) bacteria.D. Invasion of IFN-γ-treated or untreated cells by Nm at 1 and 3 h after infection. Means and SEs of one representative of several experiments are shown. To investigate NFκB activation by bacteria, IκB levels in the cytoplasmic fraction of cytokine-treated (+IFN) and untreated (–IFN) A549 cells were investigated by Western blot analysis shown in E. Lanes marked –IFN and +IFN contained extracts from cells which were not exposed to bacteria. Other lanes contained extracts from cells infected with #18.18 for 1 or 2 h as shown.F. Densitometric analysis of the bands observed in E (unstimulated cells: blank columns, stimulated cells: filled columns). Data are from one of two similar experiments.
Fig. 7
Fig. 7
Curcumin-mediated inhibition of Opa-CEACAM-dependent adhesion and invasion of unstimulated and IFN-γ-stimulated target cells. A549 monolayers either exposed to IFN-γ (filled columns) or left untreated (blank columns) were pretreated with curcumin at increasing concentrations for 30 min prior to bacterial infection. The monolayers were washed carefully three times, and bacteria were added in Medium 199 supplemented only with 2% FCS. Cellular adhesion (A) and invasion (B) by #18.18 were assessed by viable counting. Means and SEs of triplicate estimations from one of several experiments are shown. Per cent inhibition of cell association and invasion at different curcumin concentrations in the case of #18.18 is compared in C. Inhibition of the cell association (a) and invasion (i) by acapsulate C751OpaD after 100 μM curcumin pretreatment of IFN-γ-treated cells are shown as bars in C.
Fig. 8
Fig. 8
NFκB-SN50 peptide reduces cellular association and inhibits cellular invasion in unstimulated and IFN-γ-stimulated target cells. IFN-γ-treated cells (filled columns) or untreated cells (blank columns) were preincubated with NFκΒ nuclear translocation inhibitory peptide SN50 or a control peptide SN50M for 30 min prior to bacterial infection. Adhesion (A and B) and invasion (C and D) were assessed by viable counting. Mean values and SEs of triplicate estimations of representative experiments are shown. Numbers above SN50 bars are per cent inhibition of total cell association or invasion compared with controls without the peptide.
Fig. 9
Fig. 9
Immunofluorescence analysis of the localization of the p50 subunit of NFkB. A549 cells treated with NFkB inhibitors were infected with #18.18 (+bact). Monolayers were methanol fixed and labelled with anti-p50 antibody to localize the subunit of NFκB, or Dapi to localize the nuclei. The location of p50 in uninfected cells (Control) was largely cytoplasmic, whereas greater nuclear localization of p50 occurred in bacterially infected cells. This was not affected by SN50M control peptide, but was inhibited by SN50 or curcumin, resulting in cytoplasmic labelling of p50 in the latter two cases.

Similar articles

Cited by

References

    1. Aho EL, Dempsey JA, Hobbs MM, Klapper DG, Cannon JG. Characterization of the opa (class 5) gene family of Neisseria meningitidis. Mol Microbiol. 1991;5:1429–1437. - PubMed
    1. Alonso JM, Guiyoule A, Zarantonelli ML, Ramisse F, Pires R, Antignac A, et al. A model of meningococcal bacteremia after respiratory superinfection in influenza a virus-infected mice. FEMS Microbiol Lett. 2003;222:99–106. - PubMed
    1. Beadling C, Slifka MK. How do viral infections predispose patients to bacterial infections? Curr Opin Infect Dis. 2004;17:185–191. - PubMed
    1. Bhat KS, Gibbs CP, Barrera O, Morrison SG, Jahnig F, Stern A, et al. The opacity proteins of Neisseria gonorrhoeae strain MS11 are encoded by a family of 11 complete genes. Mol Microbiol. 1991;5:1889–1901. - PubMed
    1. Bjorge L, Jensen TS, Matre R. Characterisation of the complement-regulatory proteins decay-accelerating factor (DAF, CD55) and membrane cofactor protein (MCP, CD46) on a human colonic adenocarcinoma cell line. Cancer Immunol Immunother. 1996;42:185–192. - PMC - PubMed

Publication types

MeSH terms

LinkOut - more resources