Population pharmacokinetic analysis of carboxyhaemoglobin concentrations in adult cigarette smokers
- PMID: 17764477
- PMCID: PMC2291280
- DOI: 10.1111/j.1365-2125.2007.02974.x
Population pharmacokinetic analysis of carboxyhaemoglobin concentrations in adult cigarette smokers
Abstract
Aims: To develop a population-based model to describe and predict the pharmacokinetics of carboxyhaemoglobin (COHb) in adult smokers.
Methods: Data from smokers of different conventional cigarettes (CC) in three open-label, randomized studies were analysed using NONMEM (version V, Level 1.1). COHb concentrations were determined at baseline for two cigarettes [Federal Trade Commission (FTC) tar 11 mg; CC1, or FTC tar 6 mg; CC2]. On day 1, subjects were randomized to continue smoking their original cigarettes, switch to a different cigarette (FTC tar 1 mg; CC3), or stop smoking. COHb concentrations were measured at baseline and on days 3 and 8 after randomization. Each cigarette was treated as a unit dose assuming a linear relationship between the number of cigarettes smoked and measured COHb percent saturation. Model building used standard methods. Model performance was evaluated using nonparametric bootstrapping and predictive checks.
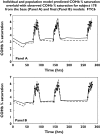
Results: The data were described by a two-compartment model with zero-order input and first-order elimination with endogenous COHb. Model parameters included elimination rate constant (k(10)), central volume of distribution (Vc/F), rate constants between central and peripheral compartments (k(12) and k(21)), baseline COHb concentrations (c0), and relative fraction of carbon monoxide absorbed (F1). The median (range) COHb half-lives were 1.6 h (0.680-2.76) and 30.9 h (7.13-367) (alpha and beta phases, respectively). F1 increased with increasing cigarette tar content and age, whereas k(12) increased with ideal body weight.
Conclusion: A robust model was developed to predict COHb concentrations in adult smokers and to determine optimum COHb sampling times in future studies.
Figures


 ); CC3, (
 ); Non-smoking, (
 ) Individual Predicted, (—))

Similar articles
-
Smoking in closed space and its effect on carboxyhaemoglobin saturation of smoking and nonsmoking subjects.Ann Clin Res. 1977 Oct;9(5):281-3. Ann Clin Res. 1977. PMID: 616214
-
Acute effects of cigarette smoking on pulmonary function.Regul Toxicol Pharmacol. 2010 Jul-Aug;57(2-3):241-6. doi: 10.1016/j.yrtph.2009.12.013. Epub 2010 Mar 15. Regul Toxicol Pharmacol. 2010. PMID: 20233598 Clinical Trial.
-
Correlation of smoking behaviour and blood carboxyhaemoglobin in bidi and cigarette smokers.Indian J Chest Dis Allied Sci. 1991 Jan-Mar;33(1):43-6. Indian J Chest Dis Allied Sci. 1991. PMID: 1791021 Clinical Trial.
-
Effect of gradually increasing carboxyhaemoglobin saturation on visual perception and psychomotor performance of smoking and nonsmoking subjects.Ann Clin Res. 1977 Oct;9(5):314-9. Ann Clin Res. 1977. PMID: 616218 Clinical Trial.
-
[Interpretation of exhaled CO levels in studies on smoking].Rev Mal Respir. 2010 Apr;27(4):293-300. doi: 10.1016/j.rmr.2009.09.004. Epub 2010 Jan 25. Rev Mal Respir. 2010. PMID: 20403540 Review. French.
Cited by
-
The effects of water pipe smoking on hematological parameters in rats.Int J Hematol Oncol Stem Cell Res. 2014 Jul 1;8(3):37-43. Int J Hematol Oncol Stem Cell Res. 2014. PMID: 25642307 Free PMC article.
-
Unexpected carboxyhemoglobin half-life during cardiopulmonary resuscitation: a case report.Int J Emerg Med. 2023 Mar 21;16(1):22. doi: 10.1186/s12245-023-00492-2. Int J Emerg Med. 2023. PMID: 36944931 Free PMC article.
-
Comparison of the behavioral effects of cigarette smoke and pure nicotine in rats.Pharmacol Biochem Behav. 2010 Aug;96(2):217-27. doi: 10.1016/j.pbb.2010.05.008. Epub 2010 May 18. Pharmacol Biochem Behav. 2010. PMID: 20494826 Free PMC article.
-
Influence of Nicotine from Diverse Delivery Tools on the Autonomic Nervous and Hormonal Systems.Biomedicines. 2022 Jan 6;10(1):121. doi: 10.3390/biomedicines10010121. Biomedicines. 2022. PMID: 35052800 Free PMC article.
-
Association of Cigarette Smoking History With Drug Abuse History and Arterial Carboxyhemoglobin in Trauma Activation Patients: A Retrospective Study.Cureus. 2024 Apr 19;16(4):e58606. doi: 10.7759/cureus.58606. eCollection 2024 Apr. Cureus. 2024. PMID: 38765416 Free PMC article.
References
-
- Green CR, Rodgman A. The Tobacco Chemists' Research Conference: a half century forum for advances in analytical methodology of tobacco and its products. Recent Adv Tobacco Sci. 1996;22:131–304.
-
- Executive Summary: A Report of the Surgen General. Washington, DC: U.S. Public Health Services; 2004. Report by the Surgeon General. The Health Consequences of Smoking.
-
- Haab P. The effect of carbon monoxide on respiration. Experientia. 1990;46:1202–6. - PubMed
-
- Salhany JM. Effect of carbon dioxide on human hemoglobin. Kinetic basis for the reduced oxygen affinity. J Biol Chem. 1972;247:3799–801. - PubMed
-
- Roughton FJ, Darling RC. The effect of carbon monoxide on the oxyhemoglobin dissociation curve. Am J Physiol. 1944;141:17–31.
Publication types
MeSH terms
Substances
LinkOut - more resources
Full Text Sources
Research Materials

