. 2007 Aug 31:1:40.
doi: 10.1186/1752-0509-1-40.

Epstein-Barr virus latency switch in human B-cells: a physico-chemical model

Affiliations

Epstein-Barr virus latency switch in human B-cells: a physico-chemical model

Maria Werner et al. BMC Syst Biol. .

Abstract

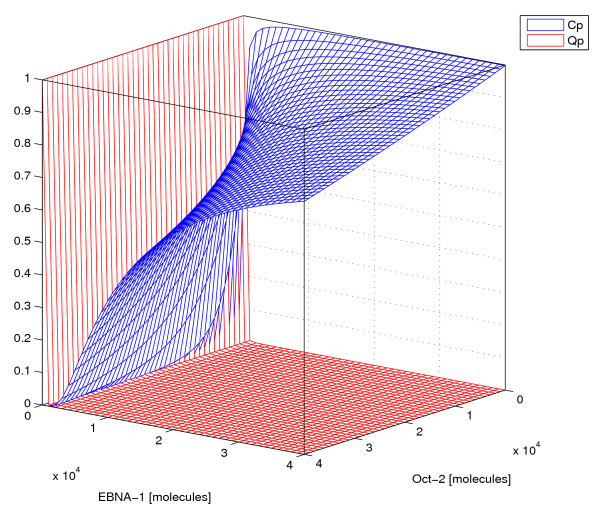
Background: The Epstein-Barr virus is widespread in all human populations and is strongly associated with human disease, ranging from infectious mononucleosis to cancer. In infected cells the virus can adopt several different latency programs, affecting the cells' behaviour. Experimental results indicate that a specific genetic switch between viral latency programs, reprograms human B-cells between proliferative and resting states. Each of these two latency programs makes use of a different viral promoter, Cp and Qp, respectively. The hypothesis tested in this study is that this genetic switch is controlled by both human and viral transcription factors; Oct-2 and EBNA-1. We build a physico-chemical model to investigate quantitatively the dynamical properties of the promoter regulation and experimentally examine protein level variations between the two latency programs.

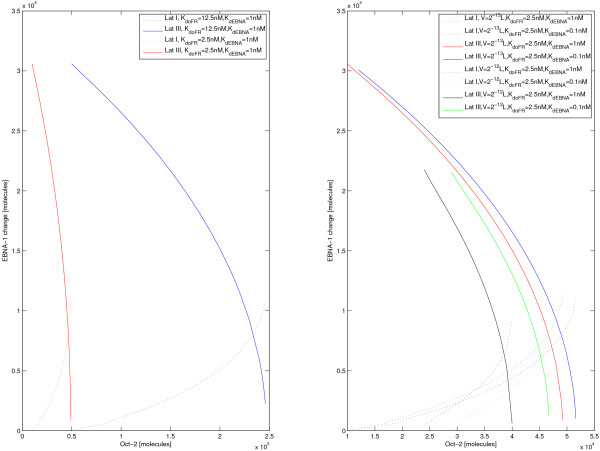
Results: Our experimental results display significant differences in EBNA-1 and Oct-2 levels between resting and proliferating programs. With the model we identify two stable latency programs, corresponding to a resting and proliferating cell. The two programs differ in robustness and transcriptional activity. The proliferating state is markedly more stable, with a very high transcriptional activity from its viral promoter. We predict the promoter activities to be mutually exclusive in the two different programs, and our relative promoter activities correlate well with experimental data. Transitions between programs can be induced, by affecting the protein levels of our transcription factors. Simulated time scales are in line with experimental results.

Conclusion: We show that fundamental properties of the Epstein-Barr virus involvement in latent infection, with implications for tumor biology, can be modelled and understood mathematically. We conclude that EBNA-1 and Oct-2 regulation of Cp and Qp is sufficient to establish mutually exclusive expression patterns. Moreover, the modelled genetic control predict both mono- and bistable behavior and a considerable difference in transition dynamics, based on program stability and promoter activities. Both these phenomena we hope can be further investigated experimentally, to increase the understanding of this important switch. Our results also stress the importance of the little known regulation of human transcription factor Oct-2.


Figures

Figure 1
Figure 1
The genetic switch. This illustration describes the regulatory mechanisms of the modeled switch between the C promoter (Cp) and the Q promoter (Qp) in Epstein-Barr virus. Transcripts from Cp are spliced into bicistronic mRNAs coding either for EBNA-1 (red) or one of the other EBNA proteins (blue), while transcripts from Qp only codes for EBNA-1. EBNA-1 itself acts as a negative regulator of Qp, binding downstream of the transcription start, and positively regulates transcription from Cp through binding upstream to the Family of Repeats sequence (FR). FR bind also Oct-2 molecules (green), in complex with Grg/TLE, acting as inhibitory regulators.
Figure 2
Figure 2
Protein levels and DNA binding. a) Western blot showing EBNA-1 and Oct-2 in latency I type cell Rael (I) and latency III type cell CBMI Ral-STO (III). Monoclonal antibodies were used to detect the proteins as described in Methods. b) Chromatin immunoprecipitation(CHiP)-assay of EBNA-1 and Oct-2 probed by PCR over the left hand of FR. The antibody-protein cross-linked and precipitated DNA was probed undiluted, diluted 1:10 and 1:100. The sources of the protein-FR complexes were the same cell lines as in a). Controls were immunpreciptation leaving out the first specific antibody, a cloned, purfied piece of FR (positive control) and PCR with no DNA (negative control) c) Control of non-specific binding of antibodies to DNA. DNA from latency III cell lysate was immunopreciptated with anti-Oct2 or anti-EBNA1, with negative and positive controls. Results show no significant background binding of the antibody.
Figure 3
Figure 3
Potential landscape. The potential landscape of the EBV kinetic system for three different levels of Oct-2+Grg/TLE. The two local minima in the potential landscape corresponds to latency I, at low EBNA-1 levels, and latency III, at high EBNA-1 levels. Increasing the Oct-2 levels in the system shift the latency III minima towards latency I and eventually it disappear completely, leaving the system in a monostable latency I state.
Figure 4
Figure 4
Promoter activity. The probability of transcription from both promoters, Cp (blue) and Qp (red) as function of EBNA-1 and Oct-2 proteins in the system. This plot shows the case when Oct-2+Grg/TLE has the maximum binding affinity to FR, KdOFR = 2.5 nM. The Qp activity is remarkably low for most EBNA-1 levels compared with the Cp activity.
Figure 5
Figure 5
Latency escapes and model robustness. Figure showing the minimum instantaneous change in EBNA-1 protein number necessary to switch from latency I to III and vice versa, as a function of the number of Oct-2+Grg/TLR proteins. For small numbers only the latency III state exists, while for large numbers only latency I state exists, compare Figure 3 and Figure 4. Left figure: red lines are at the reference parameter values, in particular Oct-2 complex binding with affinity KdOFR = 2.5 nM and an EBNA-1 dimerization dissociation constant of 1 nM. Blue lines show a five-fold weaker Oct-2 affinity (KdOFR = 12.5 nM). Similar behaviour is then displayed at approximately five-fold higher Oct-2 level. Right figure: red solid and dotted lines at reference parameter values. Blue solid and dotted lines at a tenfold stronger EBNA-1 dimerization, and green solid and dotted lines at a tenfold greater volume. The latency III state is relatively robust towards either of these changes, while the latency I state changes more. Black solid and dotted lines show both a tenfold stronger EBNA-1 dimerization and a tenfold greater volume. This influences the latency III state more, essentially because EBNA-1 concentration in the latency III state is then comparable to the EBNA-1 dimerization dissociation constant.
Figure 6
Figure 6
Dynamics of EBNA-1 and Oct-2. This plot illustrates how changes in Oct-2 levels affect the EBNA-1 levels. At time zero the system is stable in latency I, with an EBNA-1 level of 850 molecules, and an Oct-2 level of 15000 molecules. Transition to latency III is induced by lowering the Oct-2 level to 10000, activating the C promoter. Reaching the stable latency III level of EBNA-1 proteins thereafter take a few days. Induced switching back to resting latency I state demands a distinct increase in Oct-2, minimum a 10 fold change (green solid line). The greater increase in Oct-2 molecules the faster the cell is switched back to a stable latency I level of EBNA-1. The green solid and dashed line illustrate two different scenarios of elevated Oct-2 levels, where the red solid and dashed line are the corresponding resulting EBNA-1 levels.

Similar articles

Cited by

References

    1. Young LS, Rickinson AB. Epstein-Barr virus: 40 years on. Nat Rev Cancer. 2004;4:757–768. doi: 10.1038/nrc1452. - DOI - PubMed
    1. Almqvist J. Epstein-Barr virus nuclear antigen 1, Oct & Groucho/TLE in control of promoter regulation. PhD thesis, Karolinska Institutet. 2005.
    1. Amon W, Farrell PJ. Reactivation of Epstein-Barr virus from latency. Reviews in Medical Virology. 2005;15:149–156. doi: 10.1002/rmv.456. - DOI - PubMed
    1. Leight ER, Sugden B. EBNA-1: a protein pivotal to latent infection bt Epsein-barr virus. Reviews in Medical Virology. 2000;10:83–100. doi: 10.1002/(SICI)1099-1654(200003/04)10:2<83::AID-RMV262>3.0.CO;2-T. - DOI - PubMed
    1. Schaefer BC, Woisetschlager M, Strominger JL, Speck SH. Exclusive expression of Epstein-Barr virus nuclear antigen 1 in Burkitts lymphoma arises from a third promoter, distinct from the promoters used in latently infected lymphocytes. Proc Natl Acad Sci. 1991;88:6550–6554. doi: 10.1073/pnas.88.15.6550. - DOI - PMC - PubMed

Publication types

MeSH terms

Substances

LinkOut - more resources