Meta-Analysis
. 2007 Aug 31:8:302.
doi: 10.1186/1471-2164-8-302.

Gene expression profiling reveals different pathways related to Abl and other genes that cooperate with c-Myc in a model of plasma cell neoplasia

Affiliations
Meta-Analysis

Gene expression profiling reveals different pathways related to Abl and other genes that cooperate with c-Myc in a model of plasma cell neoplasia

Eun Sung Park et al. BMC Genomics. .

Abstract

Background: To elucidate the genes involved in the neoplastic transformation of B cells, global gene expression profiles were generated using Affymetrix U74Av2 microarrays, containing 12,488 genes, for four different groups of mouse B-cell lymphomas and six subtypes of pristane-induced mouse plasma cell tumors, three of which developed much earlier than the others.

Results: Unsupervised hierarchical cluster analysis exhibited two main sub-clusters of samples: a B-cell lymphoma cluster and a plasma cell tumor cluster with subclusters reflecting mechanism of induction. This report represents the first step in using global gene expression to investigate molecular signatures related to the role of cooperating oncogenes in a model of Myc-induced carcinogenesis. Within a single subgroup, e.g., ABPCs, plasma cell tumors that contained typical T(12;15) chromosomal translocations did not display gene expression patterns distinct from those with variant T(6;15) translocations, in which the breakpoint was in the Pvt-1 locus, 230 kb 3' of c-Myc, suggesting that c-Myc activation was the initiating factor in both. When integrated with previously published Affymetrix array data from human multiple myelomas, the IL-6-transgenic subset of mouse plasma cell tumors clustered more closely with MM1 subsets of human myelomas, slow-appearing plasma cell tumors clustered together with MM2, while plasma cell tumors accelerated by v-Abl clustered with the more aggressive MM3-MM4 myeloma subsets. Slow-appearing plasma cell tumors expressed Socs1 and Socs2 but v-Abl-accelerated plasma cell tumors expressed 4-5 times as much. Both v-Abl-accelerated and non-v-Abl-associated tumors exhibited phosphorylated STAT 1 and 3, but only v-Abl-accelerated plasma cell tumors lost viability and STAT 1 and 3 phosphorylation when cultured in the presence of the v-Abl kinase inhibitor, STI-571. These data suggest that the Jak/Stat pathway was critical in the transformation acceleration by v-Abl and that v-Abl activity remained essential throughout the life of the tumors, not just in their acceleration. A different pathway appears to predominate in the more slowly arising plasma cell tumors.

Conclusion: Gene expression profiling differentiates not only B-cell lymphomas from plasma cell tumors but also distinguishes slow from accelerated plasma cell tumors. These data and those obtained from the sensitivity of v-Abl-accelerated plasma cell tumors and their phosphorylated STAT proteins indicate that these similar tumors utilize different signaling pathways but share a common initiating genetic lesion, a c-Myc-activating chromosome translocation.


Figures
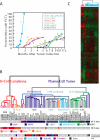
Figure 1
Figure 1
Gene expression analysis of mouse plasmacytomas and B cell lymphomas. 70 RNA samples from murine B-cell malignancies, comprised of 6 different types of mouse plasma cell tumors and 4 different types of mouse B cell lymphomas, were used for global gene expression studies. A. Kinetics of appearance of 6 different subclasses of plasma cell tumors. Time course of appearance of PCTs after ip injection of pristane. IL6PCs arose spontaneously in lymph nodes of IL-6-transgenic mice, without pristane treatment, as the mice aged. See Table 1 for more details. B and C. Unsupervised hierarchical clustering. Using Affymetrix U74A v2 microarrays, 6424 genes were used for clustering of genes and samples after filtering out genes with more than 50% of A (absence) calls. Correlation-based (uncentered) average linkage clustering was performed on log base 2-transformed data previously centered to mean expression values of each gene. Gene expressions above this mean value are colored red; those expressed below are shown in green. The cluster dendrogram shows 2 major sample clusters: a PCT cluster and a B-cell lymphoma cluster. Samples are coded with 11 different colors based on previously assigned groups. Asterisks indicate samples that clustered in an unexpected manner (see text). In the dendrogram, the PCT samples are colored blue-green and the BCL samples are red-orange. In the first color bar, different viral and transgenic contributions to PCT development are distinguished by different colors. In the second color bar, the 4 types of BCLs are color-coded. In the third color bar, mouse PCTs previously characterized for the fine structure of their Myc-activating chromosomal translocations are identified in this dendrogram. PCT samples having the variant chromosomal translocation T(6;15) are shown in deep blue, type I T(12;15) are shown in red/orange, and type II T(12;15) are shown in light blue. PCT samples having complex chromosomal translocations [12] are shown in purple, and PCT samples having no identifiable chromosomal translocations are shown in pale black. Boxes without color indicate PCTs with unknown karyotypes.
Figure 2
Figure 2
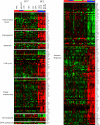
Genes showing significant differences in expression between PCTs and BCLs. Class comparison between PCTs and BCLs showed 926 genes that showed significant differences (p < 1 × 10⁻⁵) in two sample t-test. The genes assigned to 8 different functional categories by CGAP are presented as a heat map of gene cluster. Additional details can be found in Additional file 1.
Figure 3
Figure 3
Greater sensitivity of ABPCs to STI-571 than TEPCs. A. Cell proliferation analysis of PCTs after treatment with STI-571. Five different cell lines including two ABPCs (ABPC20, ABPC22), two TEPCs (TEPC1165, TEPC 2027) and one pre B v-Abl lymphoma were treated with different concentrations of STI-571 at an initial concentration of 5 × 10³ cells/well. Cell numbers were measured at 4 different times (0, 2, 4, and 7 days after treatment). B. Western blot analysis of PCTs for STAT1 phosphorylation and STAT3 phosphorylation. Samples for western blot were collected from untreated cells and cells after treatment with 5 μM STI-571 for 18 hours. Doublet bands are the α and β forms of the STAT proteins.
Figure 4
Figure 4
Quantitative real-time PCR analysis. qRT-PCR was performed on RNAs from 3 different groups of cultured cells to analyze relative mRNA content for 9 key genes: c-Myc, Socs1, Socs 2, Abl1, Jak1, Xbp1, Sdc1, Irf4, Pax5 as well as the "housekeeping gene", GAPDH, using primers and detection oligos designed in consultation with the manufacturer (ABI). The data was presented as mean ± standard deviation values of each group. qRT-PCR data for individual samples are presented as Additional file 3. All data were normalized to GAPDH. These values were then calibrated against the sample with the lowest expression and represented as -ΔΔCt values with standard errors.
Figure 5
Figure 5
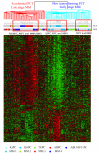
Meta-analysis of human multiple myeloma samples with mouse plasmacytomas. A total of 122 samples, comprised of 74 human samples and 48 mouse samples, were used for this meta-analysis. Human samples had previously classified into 4 different stages of multiple myeloma (MM1, MM2, MM3 and MM4, generally reflecting increasing severity or stage of disease [18]), and mouse samples were composed of 5 different PCT groups, ABPC and ABLMYCPC, "two accelerated subgroups [PCT-1 and -2] (Table 1)", and "TEPC, KiPC and IL6PC, the slower appearing subgroups [PCTs 4 – 6] (Table 1)". The stage of myeloma and group of plasma cell tumors to which each sample belongs is indicated by the color of the rows of boxes beneath sample names, with a color key beneath the heat map. The human and mouse data were normalized and standardized separately and then combined for analysis [40,41]. The genes for cluster analysis were selected by one-way ANOVA analysis (2266 genes, p-value < 0.001) of mouse PCTs, and 634 orthologs from these 2266 genes, present both in human and mouse array platforms were used for cluster analysis.

Similar articles

Cited by

References

    1. Potter M. Neoplastic development in plasma cells. Immunological Reviews. 2003;194:177–195. doi: 10.1034/j.1600-065X.2003.00061.x. - DOI - PubMed
    1. Potter M, Sklar MD, Rowe WP. Rapid viral induction of plasmacytomas in pristane primed BALB/c mice. Science. 1973;182:592–594. doi: 10.1126/science.182.4112.592. - DOI - PubMed
    1. Troppmair J, Potter M, Wax JS, Rapp UR. An altered v-raf is required in addition to v-myc in J3V1 virus for acceleration of murine plasmacytomagenesis. Proc Natl Acad Sci USA. 1989;86:9941–9945. doi: 10.1073/pnas.86.24.9941. - DOI - PMC - PubMed
    1. Clynes R, Wax J, Stanton LW, Smith-Gill S, Potter M, Marcu KB. Rapid induction of IgM-secreting murine plasmacytomas by pristane and an immunoglobulin heavy-chain promoter/enhancer-driven c-myc/v-Ha-ras retrovirus. Proc Natl Acad Sci USA. 1988;85:6067–6071. doi: 10.1073/pnas.85.16.6067. - DOI - PMC - PubMed
    1. Weissinger EM, Mischak H, Largaespada DA, Kaehler DA, Mitchell T, Smith-Gill SJ, Risser R, Mushinski JF. Induction of plasmacytomas secreting antigen-specific monoclonal antibodies with a retrovirus expressing v-abl and c-myc. Proc Natl Acad Sci USA. 1991;88:8735–8739. doi: 10.1073/pnas.88.19.8735. - DOI - PMC - PubMed

Publication types