

Stratification bias in low signal microarray studies
- PMID: 17764577
- PMCID: PMC2211509
- DOI: 10.1186/1471-2105-8-326
Stratification bias in low signal microarray studies
Abstract
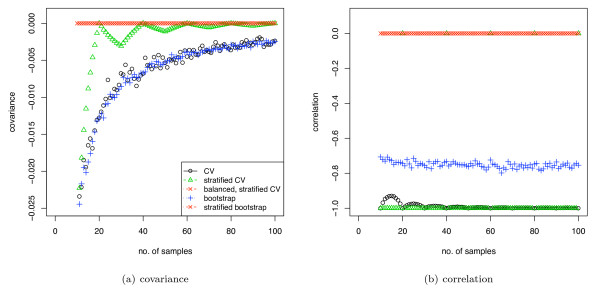
Background: When analysing microarray and other small sample size biological datasets, care is needed to avoid various biases. We analyse a form of bias, stratification bias, that can substantially affect analyses using sample-reuse validation techniques and lead to inaccurate results. This bias is due to imperfect stratification of samples in the training and test sets and the dependency between these stratification errors, i.e. the variations in class proportions in the training and test sets are negatively correlated.
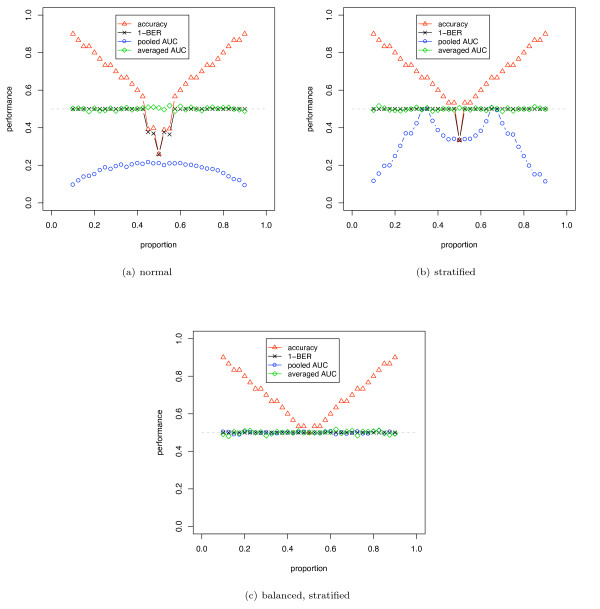
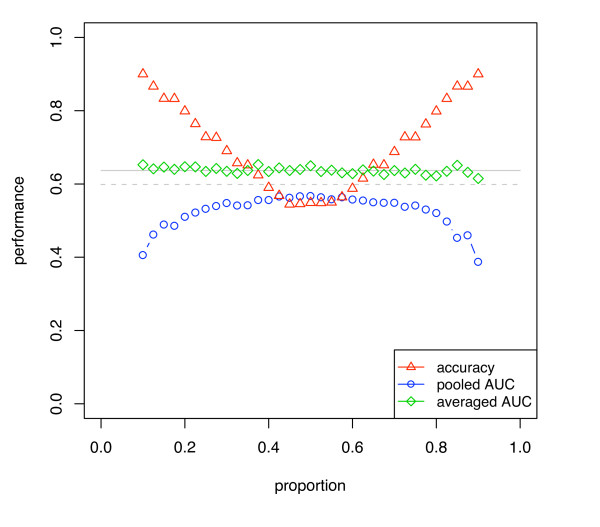
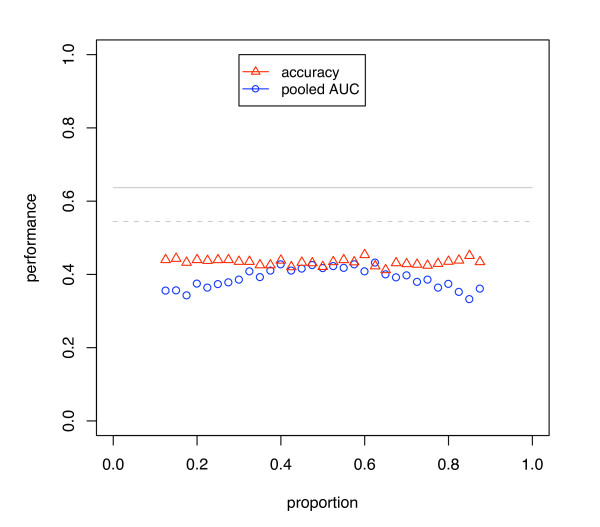
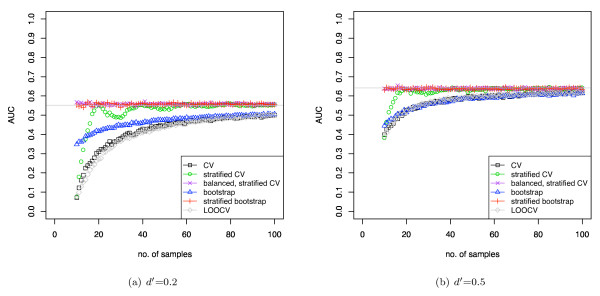
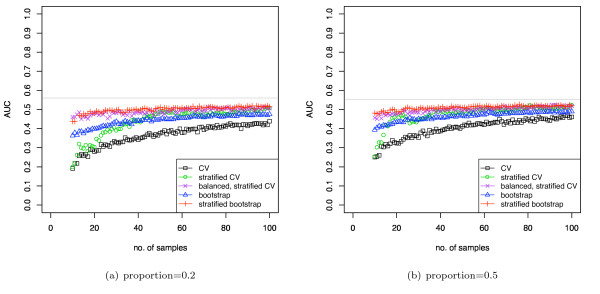
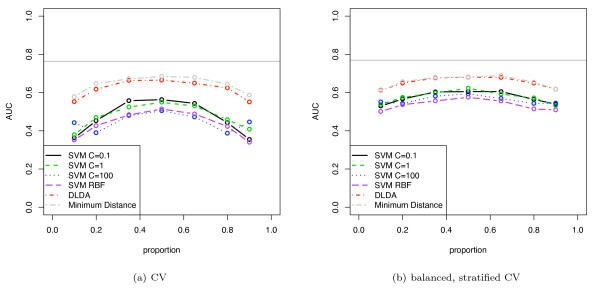
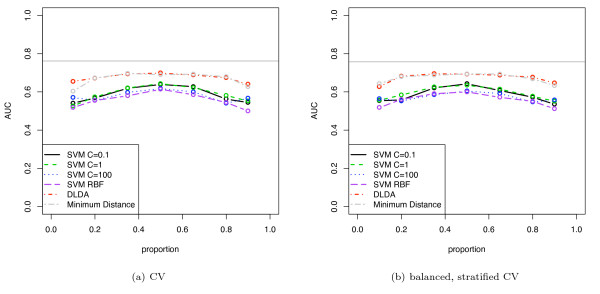
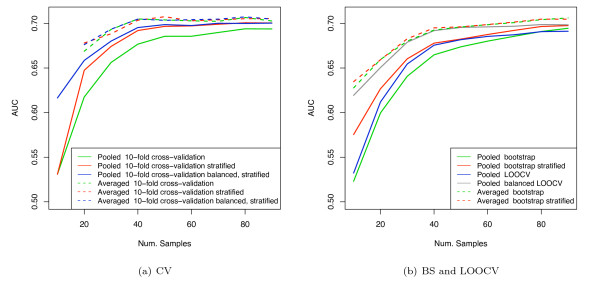
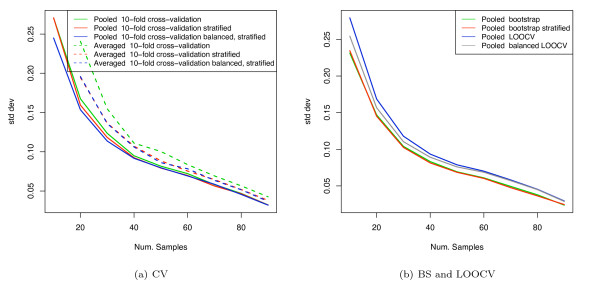
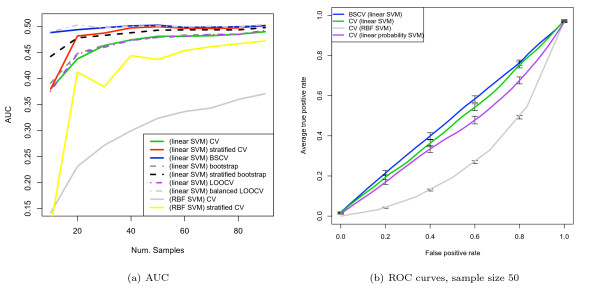
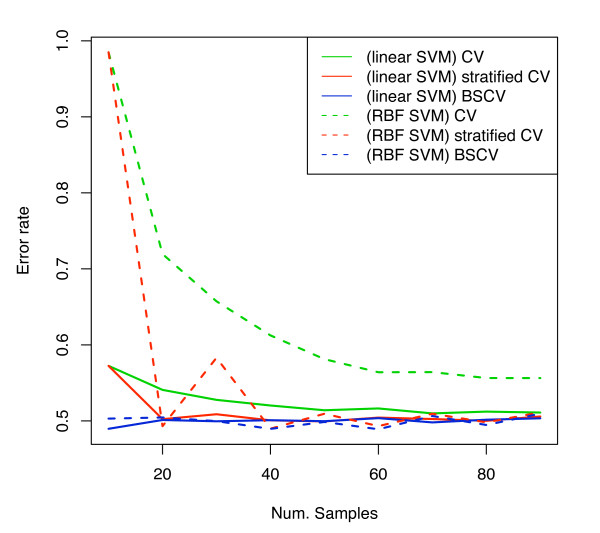
Results: We show that when estimating the performance of classifiers on low signal datasets (i.e. those which are difficult to classify), which are typical of many prognostic microarray studies, commonly used performance measures can suffer from a substantial negative bias. For error rate this bias is only severe in quite restricted situations, but can be much larger and more frequent when using ranking measures such as the receiver operating characteristic (ROC) curve and area under the ROC (AUC). Substantial biases are shown in simulations and on the van 't Veer breast cancer dataset. The classification error rate can have large negative biases for balanced datasets, whereas the AUC shows substantial pessimistic biases even for imbalanced datasets. In simulation studies using 10-fold cross-validation, AUC values of less than 0.3 can be observed on random datasets rather than the expected 0.5. Further experiments on the van 't Veer breast cancer dataset show these biases exist in practice.
Conclusion: Stratification bias can substantially affect several performance measures. In computing the AUC, the strategy of pooling the test samples from the various folds of cross-validation can lead to large biases; computing it as the average of per-fold estimates avoids this bias and is thus the recommended approach. As a more general solution applicable to other performance measures, we show that stratified repeated holdout and a modified version of k-fold cross-validation, balanced, stratified cross-validation and balanced leave-one-out cross-validation, avoids the bias. Therefore for model selection and evaluation of microarray and other small biological datasets, these methods should be used and unstratified versions avoided. In particular, the commonly used (unbalanced) leave-one-out cross-validation should not be used to estimate AUC for small datasets.
Figures
References
-
- Simon R, Radmacher M, Dobbin K, McShane L. Pitfalls in the Use of DNA Microarray Data for Diagnostic and Prognostic Classification. Journal of the National Cancer Institute. 2003;95:14–18. - PubMed
-
- Dudoit S, Fridlyand J, Speed T. Comparison of discrimination methods for the classification of tumours using gene expression data. Journal of the American Statistical Association. 2002;97:77–87. doi: 10.1198/016214502753479248. - DOI
Publication types
MeSH terms
Substances
LinkOut - more resources
Full Text Sources
Medical
Research Materials
