Baseline functional performance predicts the rate of mobility loss in persons with peripheral arterial disease
- PMID: 17765125
- PMCID: PMC2645658
- DOI: 10.1016/j.jacc.2007.05.030
Baseline functional performance predicts the rate of mobility loss in persons with peripheral arterial disease
Abstract
Objectives: We compared rates of mobility loss among persons with versus without peripheral arterial disease (PAD). Associations between baseline functional performance and mobility loss in persons with and without PAD were studied.
Background: Persons with PAD have poorer functional performance than persons without PAD. The prognostic value of poorer performance in persons with PAD is unknown.
Methods: Participants were 398 persons with and 240 without PAD who were free of mobility impairment at baseline. Participants were followed for a median of 50 months. Baseline measures included the 6-min walk and the Short Physical Performance Battery score. Mobility status, assessed annually, was defined as the self-reported loss of the ability to walk one-quarter mile or walk up and down one flight of stairs without assistance.
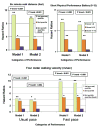
Results: Adjusting for age and gender, we found that PAD participants had a greater rate of mobility loss than persons without PAD (hazard ratio [HR] 1.63; 95% confidence interval [CI] 1.03 to 2.56). This difference was not statistically significant after additional adjustment for baseline performance. Among PAD participants, risk of mobility loss in the lowest versus the 2 highest quartiles of baseline performance were as follows: HR 9.65 (95% CI 3.35 to 27.77, p < 0.001) for the 6-min walk and HR 12.84 (95% CI 4.64 to 35.55, p < 0.001) for the Short Physical Performance Battery when adjusting for confounders.
Conclusions: Persons with PAD experience greater mobility loss than persons without PAD. This association was explained by poorer baseline functional performance among participants with PAD. Poorer lower extremity performance predicts increased mobility loss in persons with and without PAD.
Figures


Similar articles
-
Racial differences in functional decline in peripheral artery disease and associations with socioeconomic status and education.J Vasc Surg. 2017 Sep;66(3):826-834. doi: 10.1016/j.jvs.2017.02.037. Epub 2017 May 11. J Vasc Surg. 2017. PMID: 28502539 Free PMC article.
-
Associations of borderline and low normal ankle-brachial index values with functional decline at 5-year follow-up: the WALCS (Walking and Leg Circulation Study).J Am Coll Cardiol. 2009 Mar 24;53(12):1056-62. doi: 10.1016/j.jacc.2008.09.063. J Am Coll Cardiol. 2009. PMID: 19298919 Free PMC article.
-
Women with peripheral arterial disease experience faster functional decline than men with peripheral arterial disease.J Am Coll Cardiol. 2011 Feb 8;57(6):707-14. doi: 10.1016/j.jacc.2010.09.042. J Am Coll Cardiol. 2011. PMID: 21292130 Free PMC article.
-
Decline in functional performance predicts later increased mobility loss and mortality in peripheral arterial disease.J Am Coll Cardiol. 2011 Feb 22;57(8):962-70. doi: 10.1016/j.jacc.2010.09.053. J Am Coll Cardiol. 2011. PMID: 21329843 Free PMC article.
-
Leg symptom categories and rates of mobility decline in peripheral arterial disease.J Am Geriatr Soc. 2010 Jul;58(7):1256-62. doi: 10.1111/j.1532-5415.2010.02941.x. Epub 2010 Jun 11. J Am Geriatr Soc. 2010. PMID: 20550604 Free PMC article.
Cited by
-
Development and feasibility testing of a new device for home-based leg heat therapy in patients with lower extremity peripheral artery disease.J Vasc Surg Cases Innov Tech. 2024 Nov 8;11(1):101676. doi: 10.1016/j.jvscit.2024.101676. eCollection 2025 Feb. J Vasc Surg Cases Innov Tech. 2024. PMID: 39760021 Free PMC article.
-
Heart disease and stroke statistics--2011 update: a report from the American Heart Association.Circulation. 2011 Feb 1;123(4):e18-e209. doi: 10.1161/CIR.0b013e3182009701. Epub 2010 Dec 15. Circulation. 2011. PMID: 21160056 Free PMC article.
-
Association of six-minute walk distance with subsequent lower extremity events in peripheral artery disease.Vasc Med. 2020 Aug;25(4):319-327. doi: 10.1177/1358863X20901599. Epub 2020 Apr 27. Vasc Med. 2020. PMID: 32338582 Free PMC article.
-
Ischemia-related changes in circulating stem and progenitor cells and associated clinical characteristics in peripheral artery disease.Vasc Med. 2015 Dec;20(6):534-43. doi: 10.1177/1358863X15600255. Epub 2015 Aug 31. Vasc Med. 2015. PMID: 26324152 Free PMC article.
-
Racial differences in functional decline in peripheral artery disease and associations with socioeconomic status and education.J Vasc Surg. 2017 Sep;66(3):826-834. doi: 10.1016/j.jvs.2017.02.037. Epub 2017 May 11. J Vasc Surg. 2017. PMID: 28502539 Free PMC article.
References
-
- Hirsch AT, Criqui MH, Treat-Jacobson D, et al. The PARTNERS program: a national survey of peripheral arterial disease detection, awareness, and treatment. JAMA. 2001;286:1317–24. - PubMed
-
- McDermott MM, Greenland P, Liu K, et al. Leg symptoms commonly reported by men and women with lower extremity peripheral arterial disease: associated clinical characteristics and functional impairment. JAMA. 2001;286:1599–606. - PubMed
-
- McDermott MM, Greenland P, Liu K, et al. The ankle brachial index as a measure of leg functioning and physical activity in peripheral arterial disease: the walking and leg circulation study. Ann Intern Med. 2002;136:873–83. - PubMed
Publication types
MeSH terms
Grants and funding
LinkOut - more resources
Full Text Sources
Other Literature Sources

