

Architectonic distribution of the serotonin transporter within the orbitofrontal cortex of the vervet monkey
- PMID: 17766046
- PMCID: PMC2072994
- DOI: 10.1016/j.neuroscience.2007.06.038
Architectonic distribution of the serotonin transporter within the orbitofrontal cortex of the vervet monkey
Abstract
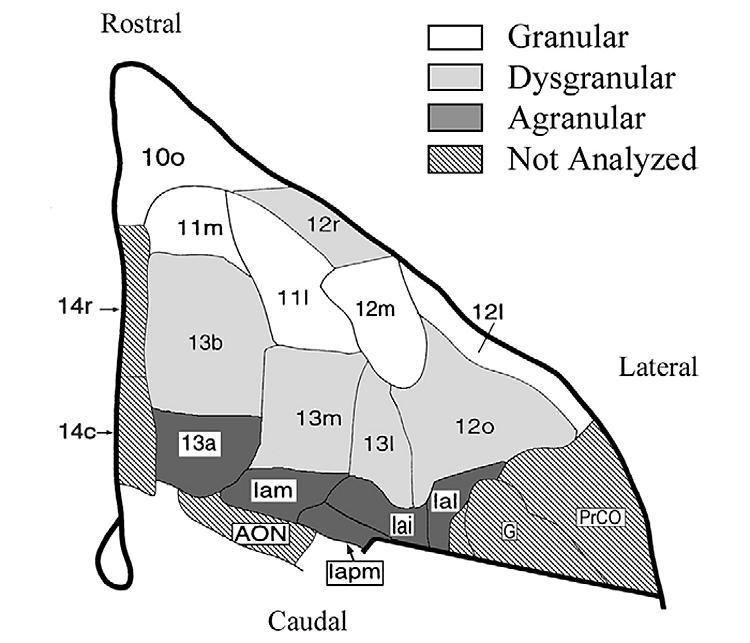
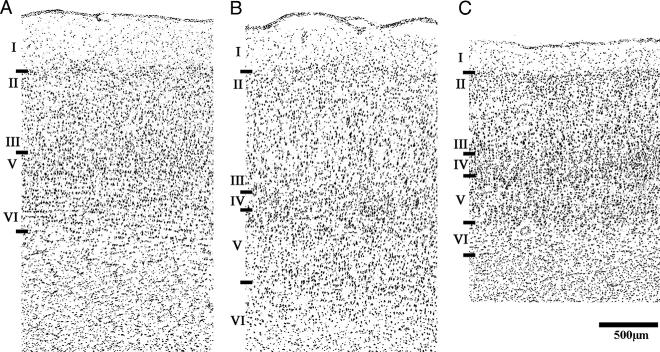
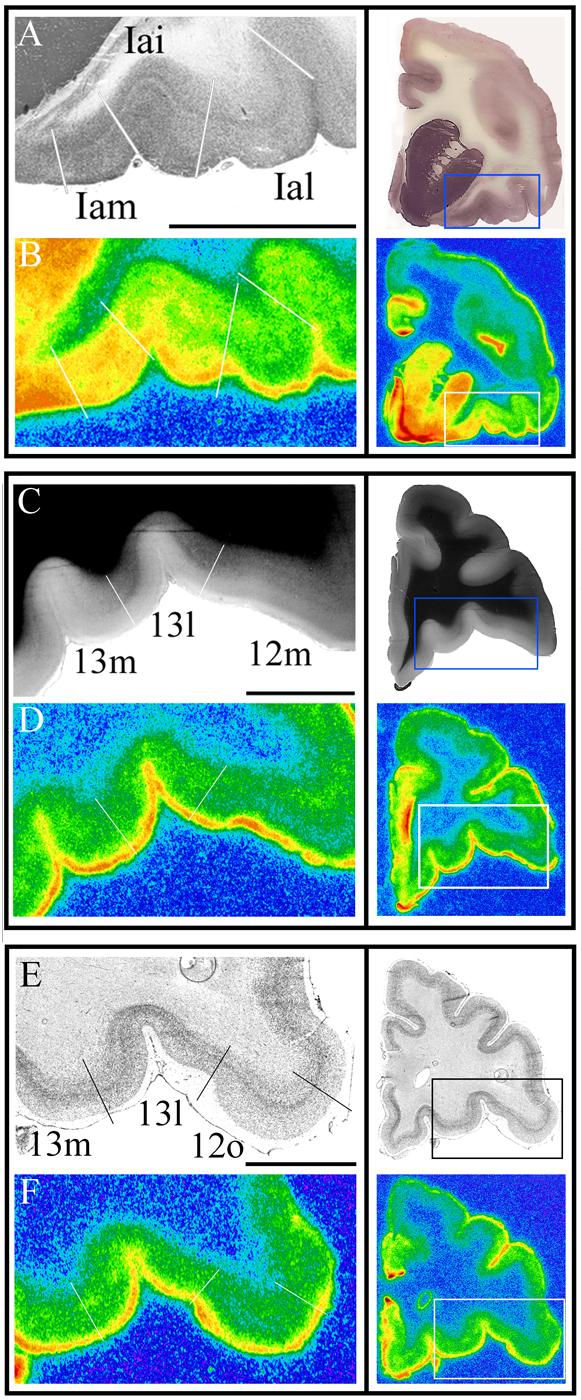
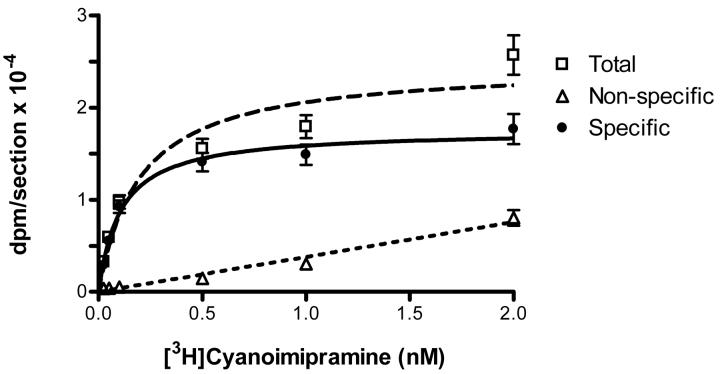
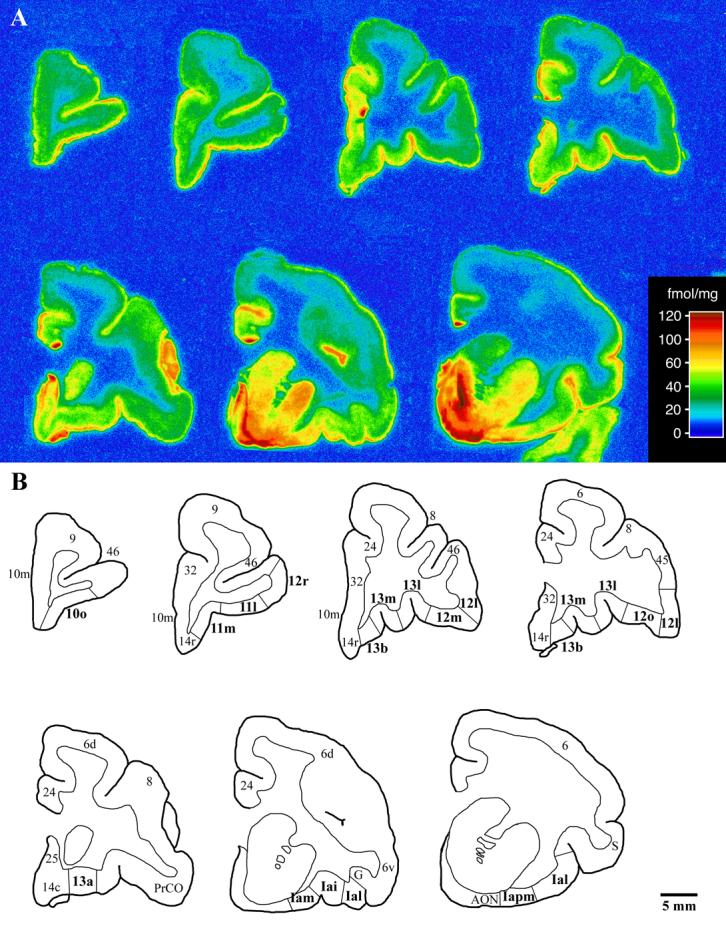
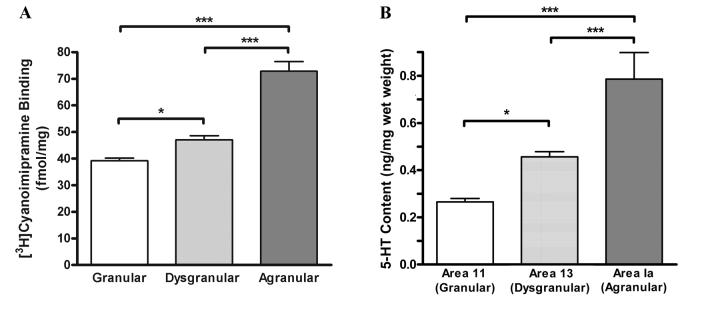
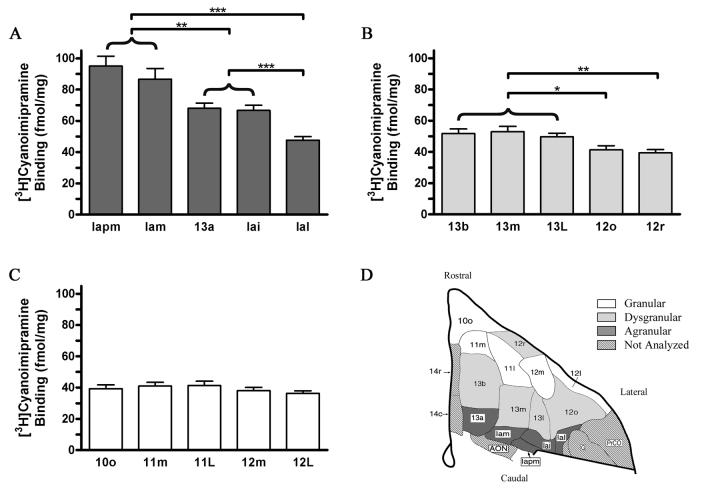
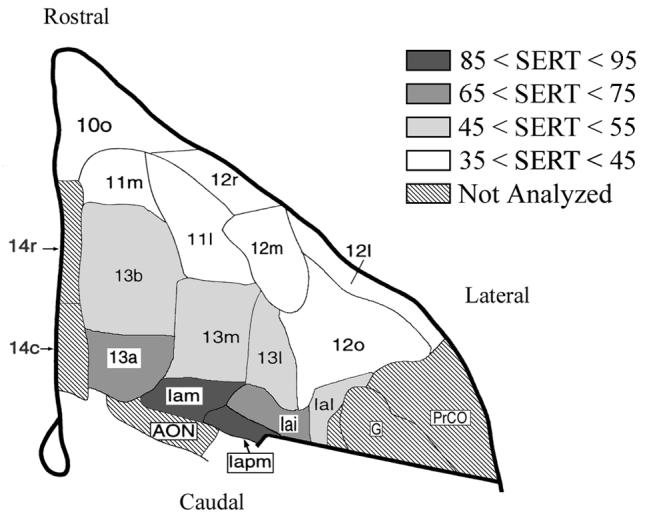
To elucidate the organization of the serotoninergic innervation within the orbitofrontal cortex (OFC), serotonin transporter (SERT) density was quantified by autoradiography using [(3)H]cyanoimipramine binding. In six adult vervet monkeys, 15 architectonic areas were delineated according to cytoarchitectonic (Nissl), myeloarchitectonic (Gallyas) and chemoarchitectonic (acetylcholinesterase) criteria to assess SERT distribution at two levels of organization: cortical area and cortical type. For cortical type, the 15 areas were evenly divided into three different categories primarily based upon the degree of granularization of layer IV: agranular, dysgranular, and granular. Within agranular and dysgranular, but not granular cortical types, SERT density was area-specific and progressively decreased in a medial to lateral gradient. Across cortical types, SERT density decreased in a caudal to rostral gradient: agranular>dysgranular>granular. A similar caudal to rostral gradient was seen when serotonin content was measured (using high performance liquid chromatography) in areas representative of each cortical type. Collectively, these results suggest that the serotoninergic innervation is organized according to both cortical type and area, and is thus structured to differentially modulate information processing within the OFC.
Figures
Similar articles
-
Neuron density and serotonin receptor binding in prefrontal cortex in suicide.Int J Neuropsychopharmacol. 2012 May;15(4):435-47. doi: 10.1017/S1461145711000691. Epub 2011 May 9. Int J Neuropsychopharmacol. 2012. PMID: 21733245 Free PMC article.
-
Role of serotonin transporter function in rat orbitofrontal cortex in impulsive choice.Behav Brain Res. 2015 Oct 15;293:134-42. doi: 10.1016/j.bbr.2015.07.025. Epub 2015 Jul 13. Behav Brain Res. 2015. PMID: 26183652 Free PMC article.
-
Quantitative architecture distinguishes prefrontal cortical systems in the rhesus monkey.Cereb Cortex. 2001 Oct;11(10):975-88. doi: 10.1093/cercor/11.10.975. Cereb Cortex. 2001. PMID: 11549620
-
Changing distribution of monoaminergic markers in the developing human cerebral cortex with special emphasis on the serotonin transporter.Anat Rec. 2002 Jun 1;267(2):87-93. doi: 10.1002/ar.10089. Anat Rec. 2002. PMID: 11997877 Review.
-
Lateral prefrontal cortex: architectonic and functional organization.Philos Trans R Soc Lond B Biol Sci. 2005 Apr 29;360(1456):781-95. doi: 10.1098/rstb.2005.1631. Philos Trans R Soc Lond B Biol Sci. 2005. PMID: 15937012 Free PMC article. Review.
Cited by
-
Organization of somatosensory cortex in the Northern grasshopper mouse (Onychomys leucogaster), a predatory rodent.J Comp Neurol. 2011 Jan 1;519(1):64-74. doi: 10.1002/cne.22504. J Comp Neurol. 2011. PMID: 21120928 Free PMC article.
-
Influence of prenatal iron deficiency and MAOA genotype on response to social challenge in rhesus monkey infants.Genes Brain Behav. 2012 Apr;11(3):278-90. doi: 10.1111/j.1601-183X.2012.00772.x. Epub 2012 Mar 13. Genes Brain Behav. 2012. PMID: 22340208 Free PMC article.
-
An imaging genetics approach to understanding social influence.Front Hum Neurosci. 2012 Jun 12;6:168. doi: 10.3389/fnhum.2012.00168. eCollection 2012. Front Hum Neurosci. 2012. PMID: 22701416 Free PMC article.
-
How serotonin shapes moral judgment and behavior.Ann N Y Acad Sci. 2013 Sep;1299(1):42-51. doi: 10.1111/nyas.12229. Ann N Y Acad Sci. 2013. PMID: 25627116 Free PMC article. Review.
-
Predicting the distribution of serotonergic axons: a supercomputing simulation of reflected fractional Brownian motion in a 3D-mouse brain model.Front Comput Neurosci. 2023 May 16;17:1189853. doi: 10.3389/fncom.2023.1189853. eCollection 2023. Front Comput Neurosci. 2023. PMID: 37265780 Free PMC article.
References
-
- Alexander GM, Schwartzman RJ, Bell RD, Yu J, Renthal A. Quantitative measurement of local cerebral metabolic rate for glucose utilizing tritiated 2-deoxyglucose. Brain Res. 1981;223:59–67. - PubMed
-
- Arango V, Underwood MD, Gubbi AV, Mann JJ. Localized alterations in pre- and postsynaptic serotonin binding sites in the ventrolateral prefrontal cortex of suicide victims. Brain Res. 1995;688:121–133. - PubMed
-
- Arango V, Underwood MD, Mann JJ. Serotonin brain circuits involved in major depression and suicide. Progress in Brain Research. 2002;136:443–453. - PubMed
-
- Barbas H. Dead tissue, living ideas: facts and theory from neuroanatomy. Cortex. 2004;40:205–206. - PubMed
-
- Barbas H, Pandya DN. Architecture and intrinsic connections of the prefrontal cortex in the rhesus monkey. J Comp Neurol. 1989;286:353–375. - PubMed
Publication types
MeSH terms
Substances
Grants and funding
LinkOut - more resources
Full Text Sources
