. 2007 Dec 15;93(12):4319-29.
doi: 10.1529/biophysj.107.111740. Epub 2007 Aug 31.

Effects of sustained length-dependent activation on in situ cross-bridge dynamics in rat hearts

Affiliations

Effects of sustained length-dependent activation on in situ cross-bridge dynamics in rat hearts

James T Pearson et al. Biophys J. .

Abstract

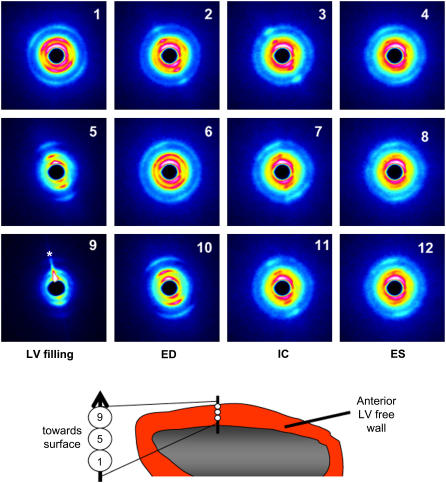
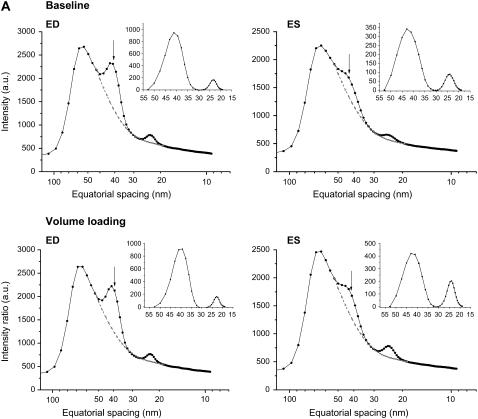
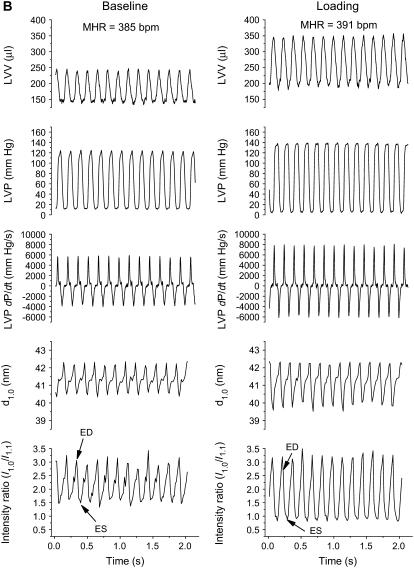
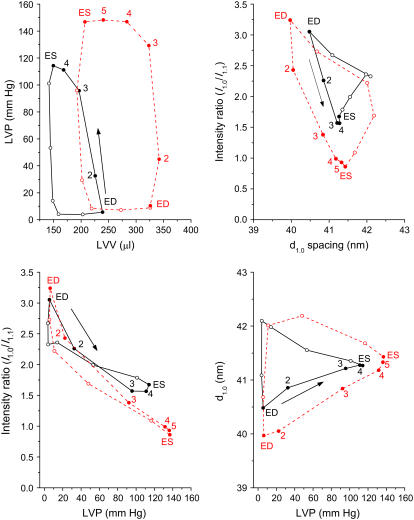
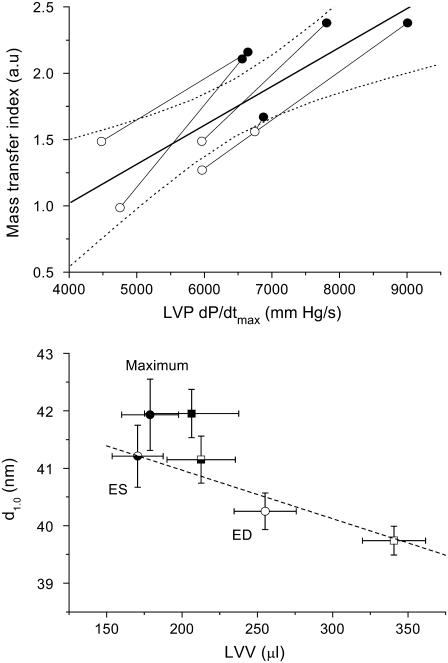
The cellular basis of the length-dependent increases in contractile force in the beating heart has remained unclear. Our aim was to investigate whether length-dependent mediated increases in contractile force are correlated with myosin head proximity to actin filaments, and presumably the number of cross-bridges activated during a contraction. We therefore employed x-ray diffraction analyses of beat-to-beat contractions in spontaneously beating rat hearts under open-chest conditions simultaneous with recordings of left ventricle (LV) pressure-volume. Regional x-ray diffraction patterns were recorded from the anterior LV free wall under steady-state contractions and during acute volume loading (intravenous lactate Ringers infusion at 60 ml/h, <5 min duration) to determine the change in intensity ratio (I(1,0)/I(1,1)) and myosin interfilament spacing (d(1,0)). We found no significant change in end-diastolic (ED) intensity ratio, indicating that the proportion of myosin heads in proximity to actin was unchanged by fiber stretching. Intensity ratio decreased significantly more during the isovolumetric contraction phase during volume loading than under baseline contractions. A significant systolic increase in myosin head proximity to actin filaments correlated with the maximum rate of pressure increase. Hence, a reduction in interfilament spacing at end-diastole ( approximately 0.5 nm) during stretch increased the proportion of cross-bridges activated. Furthermore, our recordings suggest that d(1,0) expansion was inversely related to LV volume but was restricted during contraction and sarcomere shortening to values smaller than the maximum during isovolumetric relaxation. Since ventricular volume, and presumably sarcomere length, was found to be directly related to interfilament spacing, these findings support a role for interfilament spacing in modulating cross-bridge formation and force developed before shortening.


Figures

FIGURE 1
FIGURE 1
Sequences of pseudocolor diffraction patterns obtained from the same beating rat heart in situ. Each row of patterns illustrates the cyclic changes in reflections obtained from a single muscle layer when the horizontal x-ray beam penetrated the anterior LV wall perpendicular to the long axis of the heart. Diffraction patterns presented were recorded at a sampling rate of 15 ms for a 2-s period but presented here at 30-ms intervals from early diastole (LV filling phase, leftmost column), through to ED, isovolumetric contraction phase (IC) and ES (rightmost column). Every other pattern between the patterns presented here are omitted for clarity. Illustrated are panels 1–4 from the mid-wall (subendocardial layer), 5–8 from the upper-intermediate and epicardial layers, and 9–12 from the surface epicardial layer. Asterisk in panel 9 indicates a flare due to an edge effect. Although the spread of the reflections changes with depth in the LV wall, it is clear from these patterns that vertical restraint limited muscle movements to enable continuous records from the same muscle layer on each occasion.
FIGURE 2
FIGURE 2
(A and B). Examples of changes in equatorial reflection intensities recorded during 15-ms diffraction patterns in a single cardiac cycle and the calculated beat-to-beat changes in intensity ratio (I1,0/I1,1), d1,0, and hemodynamic variables over a series of heartbeats in the same heart. (A) Intensity profiles derived from cardiac diffraction patterns recorded in vivo during baseline and volume-loading conditions illustrate 1,0 (indicated by arrows) and 1,1 intensity peaks at ED and ES. Dashed lines indicate fitted background relations. Inset panels of A indicate integrated reflection intensities. Arrows show the center of the 1,0 peak (d1,0). (B) Volume loading by intravenous infusion resulted in a significant increase in LVV and SV (maximum LVV − minimum LVV), but a minor change in LVP developed and there was no change in MHR. These global LV functional changes correlated with increased systolic change in intensity ratio and a slightly greater cyclic change in d1,0.
FIGURE 2
FIGURE 2
(A and B). Examples of changes in equatorial reflection intensities recorded during 15-ms diffraction patterns in a single cardiac cycle and the calculated beat-to-beat changes in intensity ratio (I1,0/I1,1), d1,0, and hemodynamic variables over a series of heartbeats in the same heart. (A) Intensity profiles derived from cardiac diffraction patterns recorded in vivo during baseline and volume-loading conditions illustrate 1,0 (indicated by arrows) and 1,1 intensity peaks at ED and ES. Dashed lines indicate fitted background relations. Inset panels of A indicate integrated reflection intensities. Arrows show the center of the 1,0 peak (d1,0). (B) Volume loading by intravenous infusion resulted in a significant increase in LVV and SV (maximum LVV − minimum LVV), but a minor change in LVP developed and there was no change in MHR. These global LV functional changes correlated with increased systolic change in intensity ratio and a slightly greater cyclic change in d1,0.
FIGURE 3
FIGURE 3
Mean cyclic changes in LV pressure, volume-intensity ratio (I1,0/I1,1) and myosin interfilament spacing (d1,0) in the same heart during baseline (black solid lines) and volume-loading (red dashed lines) conditions. Data presented are the average loops derived from the time series of Fig. 2. Direction of the cardiac loops is indicated by an arrow in each panel for baseline loops (not different from volume loading). In each cardiac cycle, filled symbols indicate the systolic phase of contraction (ED to ES) and numerals the sequence of data points recorded from ED (point 1) to ES.
FIGURE 4
FIGURE 4
Relation between the number of cross-bridges (mass transfer) developed locally in the anterior wall and the rate of pressure development during contractions of the beating rat hearts (upper panel) and myosin spacing (d1,0) changes in relation to LVV of the hearts (lower panel). In the upper panel, baseline means (open circles) are connected with volume-loading means (solid circles) for individual rat hearts (n = 5). A significant direct relation between mass transfer index and LVP dP/dtmax is presented for the group (thick line y = 0.00029x − 0.153, P < 0.004; dashed lines indicate 95% CI of mean). In the lower panel, the relation between d1,0 spacing during systole (interval between ED and ES) for baseline (circles) and volume-loading (squares) treatments and LVV is significant (dashed line y = 42.65 − 0.0084x, P < 0.0001), but on average 1 nm less than the maximum d1,0 recorded shortly after ES in each cycle. Open symbols indicate ED, half-closed ES and closed symbols the average recorded maximum d1,0 ± SD in all hearts (typically mean of 8–12 consecutive cardiac cycles).

Comment in

References

    1. Lew, W. Y. 1988. Time-dependent increase in left ventricular contractility following acute volume loading in the dog. Circ. Res. 63:635–647. - PubMed
    1. Cingolani, H. E., N. G. Perez, and M. C. Camilion de Hurtado. 2001. An autocrine/paracrine mechanism triggered by myocardial stretch induces changes in contractility. News Physiol. Sci. 16:88–91. - PubMed
    1. Fuchs, F., and S. H. Smith. 2001. Calcium, cross-bridges, and the Frank-Starling relationship. News Physiol. Sci. 16:5–10. - PubMed
    1. Ross, J., Jr., T. Miura, M. Kambayashi, G. P. Eising, and K.-H. Ryu. 1995. Adrenergic control of the force-frequency relation. Circulation. 92:2327–2332. - PubMed
    1. Kentish, J. C., H. E. ter Keurs, L. Ricciardi, J. J. Bucx, and M. I. Noble. 1986. Comparison between the sarcomere length-force relations of intact and skinned trabeculae from rat right ventricle. Influence of calcium concentrations on these relations. Circ. Res. 58:755–768. - PubMed

Publication types

LinkOut - more resources