. 2007 Aug;19(8):2531-43.
doi: 10.1105/tpc.107.052274. Epub 2007 Aug 31.

Arabidopsis TRANSPARENT TESTA GLABRA2 is directly regulated by R2R3 MYB transcription factors and is involved in regulation of GLABRA2 transcription in epidermal differentiation

Affiliations

Arabidopsis TRANSPARENT TESTA GLABRA2 is directly regulated by R2R3 MYB transcription factors and is involved in regulation of GLABRA2 transcription in epidermal differentiation

Tetsuya Ishida et al. Plant Cell. 2007 Aug.

Abstract

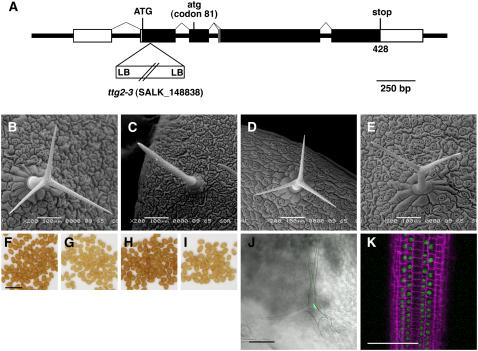
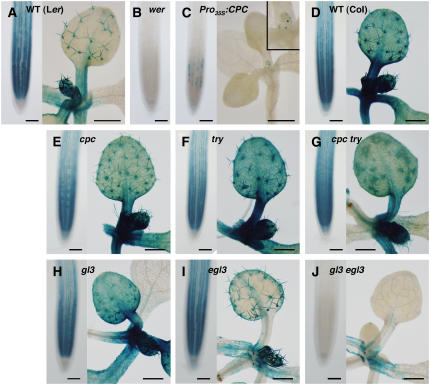
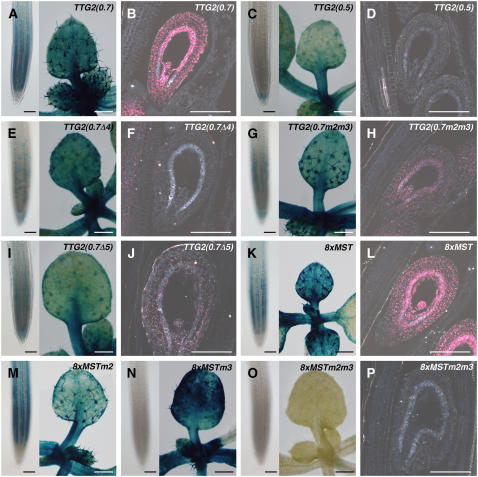
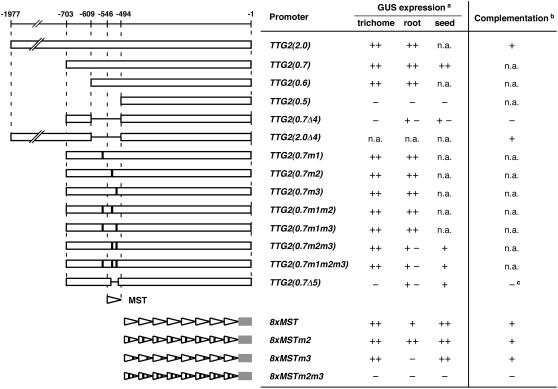
Arabidopsis thaliana TRANSPARENT TESTA GLABRA2 (TTG2) encodes a WRKY transcription factor and is expressed in young leaves, trichomes, seed coats, and root hairless cells. An examination of several trichome and root hair mutants indicates that MYB and bHLH genes regulate TTG2 expression. Two MYB binding sites in the TTG2 5' regulatory region act as cis regulatory elements and as direct targets of R2R3 MYB transcription factors such as WEREWOLF, GLABRA1, and TRANSPARENT TESTA2. Mutations in TTG2 cause phenotypic defects in trichome development and seed color pigmentation. Transgenic plants expressing a chimeric repressor version of the TTG2 protein (TTG2:SRDX) showed defects in trichome formation, anthocyanin accumulation, seed color pigmentation, and differentiation of root hairless cells. GLABRA2 (GL2) expression was markedly reduced in roots of ProTTG2:TTG2:SRDX transgenic plants, suggesting that TTG2 is involved in the regulation of GL2 expression, although GL2 expression in the ttg2 mutant was similar to that in the wild type. Our analysis suggests a new step in a regulatory cascade of epidermal differentiation, in which complexes containing R2R3 MYB and bHLH transcription factors regulate the expression of TTG2, which then regulates GL2 expression with complexes containing R2R3 MYB and bHLH in the differentiation of trichomes and root hairless cells.


Figures

Figure 1.
Figure 1.
Determination of TTG2 Gene Structure and Localization of the TTG2 Protein. (A) Schematic of the TTG2 gene. Boxes represent exons; closed boxes represent coding regions, and the gray bar in the fourth exon is absent from cDNA with alternative splicing. The ATG at codon 81 is indicated by lowercase letters. T-DNA is inserted into the second exon in the ttg2-3 mutant. LB, left border. (B) to (E) Scanning electron micrographs of trichomes of the wild type (Landsberg erecta [Ler]) (B), ttg2-1 (C), ttg2-1 transformed with the FC construct (D), and ttg2-1 transformed with the FxC construct (E). (F) to (I) Seed coat colors of the wild type (Ler) (F), ttg2-1 (G), ttg2-1 transformed with the FC construct (H), and ttg2-1 transformed with the FxC construct (I). (J) and (K) Confocal images of trichome and root expressing TTG2:2xGFP. Cell wall stained with propidium iodide is colored in magenta in (K). Bars in (B) to (E) and (J) and (K) = 100 μm, and bar in (F) (for [F] to [I]) = 1 mm.
Figure 2.
Figure 2.
Trichome Phenotypes of Double Mutants. (A) to (D) Scanning electron micrographs of trichomes of gl3-2 (A), gl3-2 ttg2-1 (B), try-82 (C), and try-82 ttg2-1 (D). The arrow indicates a trichome-like structure in (B). Bars = 100 μm. (E) Number of trichomes on fourth leaves of each genotype. Means ± sd of five plants of each genotype are shown. Trichomes are classified depending on the number of branch points. Plants were grown on soil for 21 d under continuous light.
Figure 3.
Figure 3.
TTG2 Expression in Mutants. TTG2 expression in mutants was examined in ProTTG2:GUS lines containing construct pXH2.2 [(A) to (C)] and ProTTG2(2.0):GFPGUS [(D) to (J)]. (A) GUS staining pattern of the pXH2.2 line in the wild type (Ler). Staining was detected in root N cells (left) and in young leaves, petioles, and trichomes (right). (B) No GUS staining was detected in wer-1 roots. (C) In the Pro35S:CPC line, some patchy GUS staining was detected in roots (left). GUS staining of young leaves was very weak, and a few GUS-stained trichomes were observed (inset). (D) GUS staining pattern of the ProTTG2(2.0):GFPGUS line in the wild type (Col-0). Leaf blades stained more intensely than those of the pXH2.2 line. Other tissues stained similarly to those of the pXH2.2 line. (E) In cpc-2, ectopic GUS staining was detected in some root H cells. Staining in aerial parts was similar to that in the wild type. (F) In try-29760, staining was similar to that in the wild-type. (G) In the cpc-2 try-29760 double mutant, GUS staining was detected in all epidermal root cells. GUS staining in young leaves and trichomes was similar to that in the wild type, but expression in trichomes did not last as long as in the wild type. (H) In gl3-7454, GUS staining was similar to that in the wild type. (I) In egl3-5712, GUS staining of roots was the same as in the wild type. The staining of leaf blades and petioles was reduced, but trichomes were fully stained. (J) In the gl3-7454 egl3-5712 double mutant, GUS staining was detected in leaf and cotyledon petioles but not in roots. Bars in root images = 100 μm, and bars in seedling images = 0.5 mm.
Figure 4.
Figure 4.
GUS Expression with Modified TTG2 Promoters. Seed samples were sectioned and observed under dark-field conditions, in which GUS staining appears pink ([B], [D], [F], [H], [J], [L], and [P]). (A), (C), (E), (G), (I), (K), (M), (N), and (O) GUS staining of root tips (left) and aerial parts of seedlings (right) of the ProTTG2(0.7):GFPGUS, ProTTG2(0.5):GFPGUS, ProTTG2(0.7Δ4):GFPGUS, ProTTG2(0.7m2m3):GFPGUS, ProTTG2(0.7Δ5):GFPGUS, Pro8xMST:GFPGUS, Pro8xMSTm2:GFPGUS, Pro8xMSTm3:GFPGUS, and Pro8xMSTm2m3:GFPGUS lines, respectively. (B), (D), (F), (H), (J), (L), and (P) Longitudinal sections of GUS-stained young seeds of the ProTTG2(0.7):GFPGUS, ProTTG2(0.5):GFPGUS, ProTTG2(0.7Δ4):GFPGUS, ProTTG2(0.7m2m3):GFPGUS, ProTTG2(0.7Δ5):GFPGUS, Pro8xMST:GFPGUS, and Pro8xMSTm2m3:GFPGUS lines, respectively. Bars in root and seed images = 100 μm, and bars in seedling images = 0.5 mm.
Figure 5.
Figure 5.
Summary of TTG2 Promoter Analysis. A series of deletions and base substitutions in the 5′ regulatory region of the TTG2 gene and their functions are summarized. At least 10 independent transgenic plants for each construct were examined. White boxes and arrowheads indicate the 5′ regulatory region of TTG2 for each construct. Black stripes indicate the positions of putative MYB binding sites at which base substitutions were introduced. Gray boxes indicate the cauliflower mosaic virus 35S minimal promoter. a Relative levels of GUS expression are denoted as follows: ++, strong; +, moderate; + −, patchy (root) or faint (seed); −, not detected; n.a., not analyzed. b Whether or not trichome branching is rescued was examined: +, rescued; −, not rescued; n.a., not analyzed. c Among 49 T1 transformants, one plant had wild-type trichomes and others had ttg2-like trichomes.
Figure 6.
Figure 6.
Yeast One-Hybrid Assays with R2R3 MYB Transcription Factors and the TTG2 Promoter. Yeast one-hybrid assays were used to examine the binding activities of WER, GL1, and TT2 to the MST, MSTm2, MSTm3, and MSTm2m3 fragments. pGAD424 is a negative control for effector plasmids, and pLacZi is a negative control for reporter plasmids. Data are presented as means ± sd from three independent experiments.
Figure 7.
Figure 7.
Gene Expression in the ttg2 Mutant. (A) ProGL1:GUS expression in the wild type. GUS staining was observed in young leaves and trichomes. (B) ProGL1:GUS expression in the ttg2-1 mutant. The GUS staining pattern was similar to that of the wild type (A). (C) ProWER:GFP expression in the wild type. GFP fluorescence was observed in N cells. Cell wall stained with propidium iodide is colored in magenta. (D) ProWER:GFP expression in the ttg2-1 mutant. The GFP fluorescence pattern was similar to that of the wild type (C). (E) ProCPC:GUS expression in the wild type. GUS staining was observed in N cells (left) and trichomes (right). (F) ProCPC:GUS expression in the ttg2-1 mutant. The GUS staining pattern was similar to that of the wild type (E). (G) ProGL2:GUS expression in the wild type. GUS staining was observed in N cells (left) and trichomes (right). (H) ProGL2:GUS expression in the ttg2-1 mutant. The GUS staining pattern was similar to that of the wild type (G). Bars in root images = 100 μm, and bars in seedling images = 0.5 mm.
Figure 8.
Figure 8.
Phenotypes of ProTTG2:TTG2:SRDX Transgenic Plants. Comparison of phenotypes of the ProTTG2:TTG2:SRDX transgenic plant ([I] to [L]) with that of the wild type (Col-0) ([A] to [D]), ttg2-3 ([E] to [H]), and ttg1-11 ([M] to [P]). (A) Hairless cell files separate root hair cell files in wild-type roots. (B) Wild-type leaves with three-branched trichomes. (C) Anthocyanin is accumulated at the junction of the hypocotyl and cotyledons in wild-type seedlings. (D) Seed coat color of the wild type is dark brown. (E) Distribution of root hairs in ttg2-3 is similar to that in the wild type (A). (F) The number of trichomes per leaf is reduced and most trichomes are unbranched in ttg2-3. (G) Anthocyanin accumulation in ttg2-3 is similar to that of the wild type (C). (H) Seed coat of ttg2-3 is pale brown. (I) Root hairs are formed from all cell files in ProTTG2:TTG2:SRDX transgenic plants. (J) Glabrous leaves of ProTTG2:TTG2:SRDX transgenic plants. (K) Anthocyanin is not accumulated in ProTTG2:TTG2:SRDX transgenic plants. (L) Seed coat color of ProTTG2:TTG2:SRDX transgenic plants is much paler than that of ttg2-3. (M) Root hair cell files are adjacent in ttg1-11. (N) Glabrous leaves of ttg1-11 are similar to those of ProTTG2:TTG2:SRDX transgenic plants. (O) Anthocyanin is not accumulated in ttg1-11 or in ProTTG2:TTG2:SRDX transgenic plants. (P) Seed coat color of ttg1-11 is similar to that of ProTTG2:TTG2:SRDX transgenic plants. Bars = 0.5 mm.
Figure 9.
Figure 9.
Gene Expression in Roots of ProTTG2:TTG2:SRDX Transgenic Plants. Expression of genes involved in regulating the differentiation of root epidermis was analyzed by real-time RT-PCR and reporter constructs. (A) Real-time RT-PCR analysis of WER, CPC, GL3, EGL3, TTG1, endogenous TTG2 [TTG2 (endo)], and GL2 expression in root tissue of the wild type (Col-0), ttg2-3, and two independent ProTTG2:TTG2:SRDX lines (SRDX#8 and SRDX#12). Expression levels are given in relative units, with the wild-type level serving as 1 unit. The mean ± sd of four separate reactions (two replicates of each of two separate biological replicates) is indicated for each sample. (B) Comparison of ProGL2:GUS expression in roots of the wild type (left) with that of ProTTG2:TTG2:SRDX transgenic plants (right). (C) Comparison of ProTTG2:GFPGUS expression in roots of the wild type (left) with that of ProTTG2:TTG2:SRDX transgenic plants (right). (D) Comparison of ProCPC:GUS expression in roots of the wild type (left) with that of ProTTG2:TTG2:SRDX transgenic plants (right). (E) Comparison of ProWER:GFP expression in roots of the wild type (left) with that of ProTTG2:TTG2:SRDX transgenic plants (right). Cell wall stained with propidium iodide is colored in magenta. Bars in (B) to (E) = 100 μm.
Figure 10.
Figure 10.
Proposed Model for TTG2 in Epidermal Cell Differentiation. Black arrows indicate positive regulation, and the thickness of the lines indicates degree of contribution. The red arrow indicates intercellular movement of the R3 MYB protein to inhibit interaction between R2R3 MYB and bHLH in adjacent cells.

References

    1. Baudry, A., Heim, M.A., Dubreucq, B., Caboche, M., Weisshaar, B., and Lepiniec, L. (2004). TT2, TT8, and TTG1 synergistically specify the expression of BANYULS and proanthocyanidin biosynthesis in Arabidopsis thaliana. Plant J. 39 366–380. - PubMed
    1. Bernhardt, C., Lee, M.M., Gonzalez, A., Zhang, F., Lloyd, A., and Schiefelbein, J. (2003). The bHLH genes GLABRA3 (GL3) and ENHANCER OF GLABRA3 (EGL3) specify epidermal cell fate in the Arabidopsis root. Development 130 6431–6439. - PubMed
    1. Borevitz, J.O., Xia, Y., Blount, J., Dixon, R.A., and Lamb, C. (2000). Activation tagging identifies a conserved MYB regulator of phenylpropanoid biosynthesis. Plant Cell 12 2383–2394. - PMC - PubMed
    1. Czechowski, T., Bari, R.P., Stitt, M., Scheible, W.R., and Udvardi, M.K. (2004). Real-time RT-PCR profiling of over 1400 Arabidopsis transcription factors: Unprecedented sensitivity reveals novel root- and shoot-specific genes. Plant J. 38 366–379. - PubMed
    1. Di Cristina, M., Sessa, G., Dolan, L., Linstead, P., Baima, S., Ruberti, I., and Morelli, G. (1996). The Arabidopsis Athb-10 (GLABRA2) is an HD-Zip protein required for regulation of root hair development. Plant J. 10 393–402. - PubMed

MeSH terms

Associated data