. 2007 Sep 3:8:328.
doi: 10.1186/1471-2105-8-328.

GeneSrF and varSelRF: a web-based tool and R package for gene selection and classification using random forest

Affiliations

GeneSrF and varSelRF: a web-based tool and R package for gene selection and classification using random forest

Ramón Diaz-Uriarte. BMC Bioinformatics. .

Abstract

Background: Microarray data are often used for patient classification and gene selection. An appropriate tool for end users and biomedical researchers should combine user friendliness with statistical rigor, including carefully avoiding selection biases and allowing analysis of multiple solutions, together with access to additional functional information of selected genes. Methodologically, such a tool would be of greater use if it incorporates state-of-the-art computational approaches and makes source code available.

Results: We have developed GeneSrF, a web-based tool, and varSelRF, an R package, that implement, in the context of patient classification, a validated method for selecting very small sets of genes while preserving classification accuracy. Computation is parallelized, allowing to take advantage of multicore CPUs and clusters of workstations. Output includes bootstrapped estimates of prediction error rate, and assessments of the stability of the solutions. Clickable tables link to additional information for each gene (GO terms, PubMed citations, KEGG pathways), and output can be sent to PaLS for examination of PubMed references, GO terms, KEGG and and Reactome pathways characteristic of sets of genes selected for class prediction. The full source code is available, allowing to extend the software. The web-based application is available from http://genesrf2.bioinfo.cnio.es. All source code is available from Bioinformatics.org or The Launchpad. The R package is also available from CRAN.

Conclusion: varSelRF and GeneSrF implement a validated method for gene selection including bootstrap estimates of classification error rate. They are valuable tools for applied biomedical researchers, specially for exploratory work with microarray data. Because of the underlying technology used (combination of parallelization with web-based application) they are also of methodological interest to bioinformaticians and biostatisticians.


Figures

Figure 1
Figure 1
Example output. Some figures from the output of the web-based application (see [24]). a) Out-of-bag error rate vs. the number of genes in the class prediction model, for both the complete, original data set (red line) and the 200 bootstrap samples (black lines). These figures can help identify the best number of genes in the class prediction model. It seems, that we can do fairly well using just 2 genes in our model. This is the conclussion we reach both with the complete, original data set and the bootstrap samples. b) Probability of class membership of each sample, from out-of-bag samples (i.e., bootstrap runs where the sample was not included in the training group). Most samples are well classified, specially those from class ALL (their average out of bag probability of membership in their true class is larger than 0.75). c) Importance spectrum plots can help decide on the number of "relevant variables": we compare the variable importance plots from the original data with variable importance plots that are generated when the class labels and the predictors are independent (class labels are randomly permuted). In this case the first 30 variables have importances well above those from sets with randomly permuted class labels. d) Selection probability plots: for each of the top ranked genes from the original sample, the probability that it is included among the top ranked k genes (blue: k = 20; red: k = 100) from the (200) bootstrap samples. Thus, these plots can be a measure of our confidence in the stability of choosing a number of k ranked genes. In this case, with k = 20 only the two or three most important genes are repeatedly chosen among the best 20. If we select the first 100 genes, the 30 best ranked ones appear at least in 75% of the bootstrap samples.
Figure 2
Figure 2
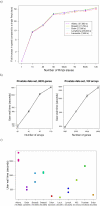
Benchmarks and run time. a) Fold increase in speed from parallelization. Ratios of the user wall time of execution of the R code (varSelRFBoot without previous model fit) between a run with a single Rmpi slave and runs with different numbers of Rmpi slaves (the number of simultaneously executing R processes) for five data sets (see [1] for details). In the legend, in parentheses the user wall time of the execution with a single Rmpi slave for each data set. In all cases (except "1", "60(2)", and "90(3)") there were four Rmpi slaves per node. The timings were obtained in an otherwise idle cluster with 30 nodes, each with two dual-core AMD Opteron 2.2 GHz CPUs and 6 GB RAM, running Debian GNU/Linux and a stock 2.6.8 kernel, with version 7.1.2 of LAM/MPI and version 2.1.4 (patched) of R. The values for "60(2)" refer two a configuration with 2 slaves per node (recall that a node with two dual core CPUs is not identical to a node with 4 CPUs), and the value "90(3)" to a configuration with 3 slaves per node. b) Scaling of user wall time. User wall time as a function of number of arrays and number of genes when executing the R function varSelRFBoot without previous model fit. Shown are three replicate runs. In each run, the arrays and genes are selected randomly from the complete original data set. Further details about the Prostate data set from [1]. Hardware and software as above. We used 4 Rmpi slaves per node (and, thus, a total of 120 slaves). c) User wall time of the web-based application. User wall time for complete runs (i.e., including upload of files and return of complete HTML page) for ten different data sets (see details in [1]). Under the name of each data set, the number of arrays and the number of genes are indicated. For each data set, three replicate runs were conducted. Hardware and software configuration as above, with the default settings for the web-based application (4 Rmpi slaves per node, and thus a total of 120 slaves).

Similar articles

Cited by

References

    1. Díaz-Uriarte R, Alvarez de Andrés S. Gene selection and classification of microarray data using random forest. BMC Bioinformatics. 2006;7:3. - PMC - PubMed
    1. Ambroise C, McLachlan GJ. Selection bias in gene extraction on the basis of microarray gene-expression data. Proc Natl Acad Sci USA. 2002;99:6562–6566. - PMC - PubMed
    1. Simon R, Radmacher MD, Dobbin K, McShane LM. Pitfalls in the use of DNA microarray data for diagnostic and prognostic classification. Journal of the National Cancer Institute. 2003;95:14–18. - PubMed
    1. Varma S, Simon R. Bias in error estimation when using cross-validation for model selection. BMC Bioinformatics. 2006;7 - PMC - PubMed
    1. Dudoit S, Fridlyand J. Classification in microarray experiments. In: Speed T, editor. Statistical analysis of gene expression microarray data. New York: Chapman & Hall; 2003. pp. 93–158.

Publication types