. 2007 Sep 3:7:156.
doi: 10.1186/1471-2148-7-156.

New analysis for consistency among markers in the study of genetic diversity: development and application to the description of bacterial diversity

Affiliations

New analysis for consistency among markers in the study of genetic diversity: development and application to the description of bacterial diversity

Sandrine Pavoine et al. BMC Evol Biol. .

Abstract

Background: The development of post-genomic methods has dramatically increased the amount of qualitative and quantitative data available to understand how ecological complexity is shaped. Yet, new statistical tools are needed to use these data efficiently. In support of sequence analysis, diversity indices were developed to take into account both the relative frequencies of alleles and their genetic divergence. Furthermore, a method for describing inter-population nucleotide diversity has recently been proposed and named the double principal coordinate analysis (DPCoA), but this procedure can only be used with one locus. In order to tackle the problem of measuring and describing nucleotide diversity with more than one locus, we developed three versions of multiple DPCoA by using three ordination methods: multiple co-inertia analysis, STATIS, and multiple factorial analysis.

Results: This combination of methods allows i) testing and describing differences in patterns of inter-population diversity among loci, and ii) defining the best compromise among loci. These methods are illustrated by the analysis of both simulated data sets, which include ten loci evolving under a stepping stone model and a locus evolving under an alternative population structure, and a real data set focusing on the genetic structure of two nitrogen fixing bacteria, which is influenced by geographical isolation and host specialization. All programs needed to perform multiple DPCoA are freely available.

Conclusion: Multiple DPCoA allows the evaluation of the impact of various loci in the measurement and description of diversity. This method is general enough to handle a large variety of data sets. It complements existing methods such as the analysis of molecular variance or other analyses based on linkage disequilibrium measures, and is very useful to study the impact of various loci on the measurement of diversity.


Figures
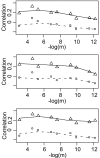
Figure 1
Figure 1
Mantel and Rv correlations between atypical and other loci in the simulated data set. The parameter m is the migration rate of the simulated linear stepping stone. Each statistic is calculated and averaged between the atypical locus and the first 10 loci submitted to a stepping stone model, A) with both allele frequency and distance information, B) with allele distances without allele frequencies, C) with allele frequencies without allele distances. Plain lines with triangle-shaped symbols mark the average correlation values, while the broken lines with open circles indicate the average Mantel correlation values.
Figure 2
Figure 2
Mantel and Rv correlations among the ten first loci in the simulated data set. The parameter m is the migration rate of the simulated linear stepping stone. Each statistic is calculated on 10 loci submitted to this stepping stone model, A) with allele frequency and distance information, B) with allele distances without allele frequencies, C) with allele frequencies without allele distances. Symbol legends are given at the bottom of the graphs.
Figure 3
Figure 3
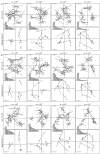
Application of the DPCoA-MCoA to the simulateddata set. The parameter m is the migration rate of the simulated linear stepping stone. The DPCoA-MCoA was applied on the simulated data set, A) with allele frequency and distance information, B) with allele distances without allele frequencies, C) with allele frequencies without allele distances. Each figure A) B) and C) comprises two series of four subfigures. In the first row, for each locus the compromise pattern of differences among populations (Numbers in boxes) is given with lines relating the compromise to the ten first loci submitted to the stepping stone model. In the second row, for each locus the compromise pattern of population differences is also given at the beginning of the arrows, and this time, the arrows point at the position of each population according to the atypical locus. The longer the arrow, the more different the pattern inferred by the atypical locus from the compromise pattern. Eigenvalue barplots are provided for analyses A), B), and C).
Figure 4
Figure 4
Location of genetic markers on the genome of Sinorhizobium meliloti strain 1021. Gene clusters located nearby each genetic marker are indicated by black boxes. It is noteworthy that the IGSNOD marker is located near genes involved in symbiotic specificity (nod genes), symbiotic efficiency (nif/fix genes), secretion (virB gene) and conjugation (tra genes). IGSRKP and IGSEXO are located near genes involved in the synthesis of surface polysaccharides, which are also involved in the symbiotic interaction. IGSGAB is physically close to genes involved in secondary metabolic pathways.
Figure 5
Figure 5
Neighbor-Joining trees for the representation of the distances among alleles. The alleles belonging to S. medicae isolates are surrounded by a plain-line circle. Only IGSNOD presents alleles found only in S. meliloti bv. meliloti populations and alleles found only in S. meliloti bv. medicaginis. Consequently, for IGSNOD, alleles are also divided according the two biovars of S. meliloti, by broken-line circles. Bootstrap values higher than 50% are given in boxes. Nodes with bootstrap values higher than 50% are indicated by plain circles and in case of possible ambiguity, a broken line links the node to the bootstrap value. The interrupted lines have a length of 0.0986 for IGSNOD, 0.1075 for IGSEXO, 0.0456 for IGSGAB and 0.0421 for IGSRKP.
Figure 6
Figure 6
Application of the DPCoA-MCoA to the real data set. A) Comparison between the patterns of the differences among populations given by the compromise over all loci (black dots, start of the arrows) and the individual analyses (end of the arrows). The special status of IGSNOD is highlighted by horizontal arrows (wrong assignment on the first axis), whereas IGSGAB, IGSRKP and IGSEXO presents vertical arrows (discrepancies from the compromise structure on axis 2 only); B) Location of the alleles. A low (or high) variance in allele points on an axis indicates that the diversity among alleles within populations is lower (or higher) than the diversity among populations, because each axis is normalized for diversity among populations. An eigenvalue barplot is provided in the left-hand corner.
Figure 7
Figure 7
Application of the DPCoA-STATIS to the real data set. A) The interstructure which displays the eigenanalysis of the matrix, and B) the best compromise. Eigenvalue barplots are provided in boxes. In the interstructure (A), the smaller the angle between two loci, the more similar the inter-population patterns provided by the two loci.
Figure 8
Figure 8
Application of the DPCoA-MFA to the real data set. A) Patterns of population differences, and B) allele differences per locus. An eigenvalue barplot is provided at the left-hand corner. Only "mlt" (respectively "mdc") is written when no differentiation can be done on the graphs among S. meliloti (respectively S. medicae) populations.
Figure 9
Figure 9
Effects of allele frequencies and distances in thereal data set. We applied the DPCoA-MCoA to A) the data set with allele distances without allele frequencies; B) the data set with allele frequencies, without allele distances. In each of the two cases A) and B), each plot gives a comparison between the patterns of the differences among populations given by the compromise over all loci (black dots, start of the arrows) and the individual analyses (end of the arrows).

Similar articles

Cited by

References

    1. Cooper JE, Feil EJ. Multilocus sequence typing: what is resolved? Trends in Microbiology. 2004;12:373–377. doi: 10.1016/j.tim.2004.06.003. - DOI - PubMed
    1. Hanage WP, Fraser C, Spratt BG. The impact of homologous recombination on the generation of diversity in bacteria. Journal of Theoretical Biology. 2006;239:210–209. doi: 10.1016/j.jtbi.2005.08.035. - DOI - PubMed
    1. Fraser C, Hanage WP, Spratt BG. Neutral microepidemic evolution of bacterial pathogens. Proceedings of the National Academy of Sciences of the United States of America. 2005;102:1968–1973. doi: 10.1073/pnas.0406993102. - DOI - PMC - PubMed
    1. Metzker ML. Emerging technologies in DNA sequencing. Genome Research. 2005;15:1767–1776. doi: 10.1101/gr.3770505. - DOI - PubMed
    1. Moazami-Goudarzi K, Laloë D. Is a multivariate consensus representation of genetic relationships among populations always meaningful? Genetics. 2002;162:473–484. - PMC - PubMed

Publication types

Substances

LinkOut - more resources