

Modeling HIV quasispecies evolutionary dynamics
- PMID: 17767733
- PMCID: PMC1963478
- DOI: 10.1186/1471-2148-7-S2-S5
Modeling HIV quasispecies evolutionary dynamics
Abstract
Background: During the HIV infection several quasispecies of the virus arise, which are able to use different coreceptors, in particular the CCR5 and CXCR4 coreceptors (R5 and X4 phenotypes, respectively). The switch in coreceptor usage has been correlated with a faster progression of the disease to the AIDS phase. As several pharmaceutical companies are starting large phase III trials for R5 and X4 drugs, models are needed to predict the co-evolutionary and competitive dynamics of virus strains.
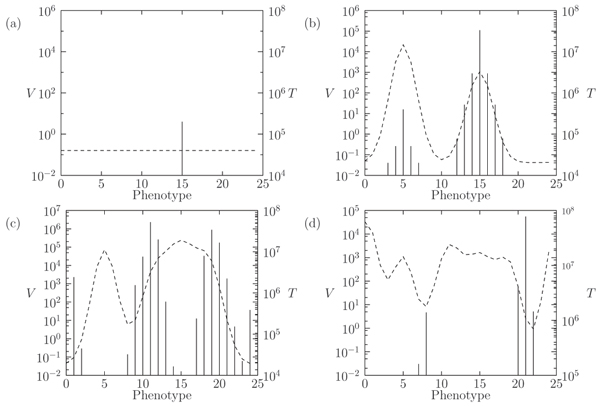
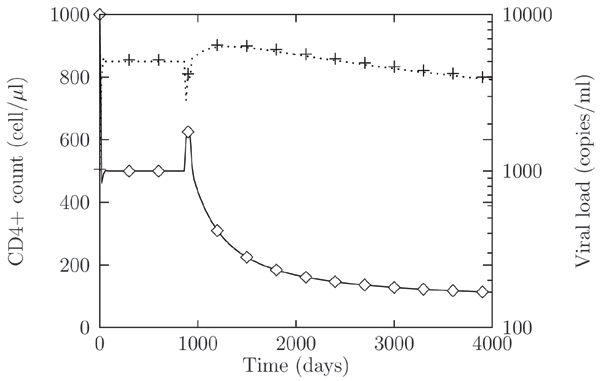
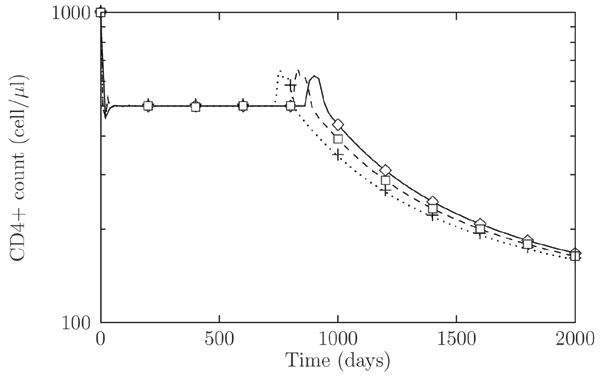
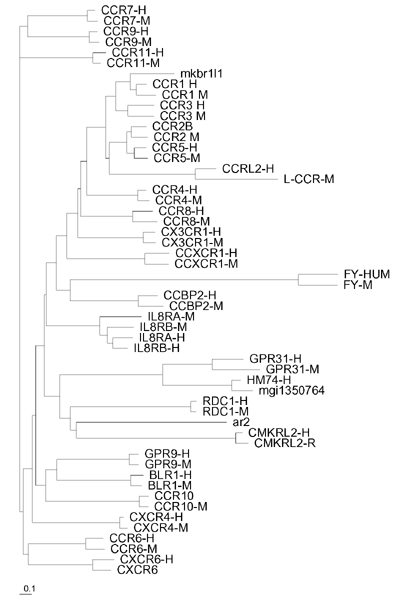
Results: We present a model of HIV early infection which describes the dynamics of R5 quasispecies and a model of HIV late infection which describes the R5 to X4 switch. We report the following findings: after superinfection (multiple infections at different times) or coinfection (simultaneous infection by different strains), quasispecies dynamics has time scales of several months and becomes even slower at low number of CD4+ T cells. Phylogenetic inference of chemokine receptors suggests that viral mutational pathway may generate a large variety of R5 variants able to interact with chemokine receptors different from CXCR4. The decrease of CD4+ T cells, during AIDS late stage, can be described taking into account the X4-related Tumor Necrosis Factor dynamics.
Conclusion: The results of this study bridge the gap between the within-patient and the inter-patients (i.e. world-wide) evolutionary processes during HIV infection and may represent a framework relevant for modeling vaccination and therapy.
Figures
Similar articles
-
Existence of Replication-Competent Minor Variants with Different Coreceptor Usage in Plasma from HIV-1-Infected Individuals.J Virol. 2020 Jun 1;94(12):e00193-20. doi: 10.1128/JVI.00193-20. Print 2020 Jun 1. J Virol. 2020. PMID: 32295903 Free PMC article.
-
High intrapatient HIV-1 evolutionary rate is associated with CCR5-to-CXCR4 coreceptor switch.Infect Genet Evol. 2013 Oct;19:369-77. doi: 10.1016/j.meegid.2013.05.004. Epub 2013 May 11. Infect Genet Evol. 2013. PMID: 23672855
-
Increased neutralization sensitivity of recently emerged CXCR4-using human immunodeficiency virus type 1 strains compared to coexisting CCR5-using variants from the same patient.J Virol. 2007 Jan;81(2):525-31. doi: 10.1128/JVI.01983-06. Epub 2006 Nov 1. J Virol. 2007. PMID: 17079299 Free PMC article.
-
Genotypic coreceptor analysis.Eur J Med Res. 2007 Oct 15;12(9):453-62. Eur J Med Res. 2007. PMID: 17933727 Review.
-
HIV-1 infection and chemokine receptor modulation.Curr HIV Res. 2004 Jan;2(1):39-50. doi: 10.2174/1570162043484997. Curr HIV Res. 2004. PMID: 15053339 Review.
Cited by
-
Formal reasoning on qualitative models of coinfection of HIV and Tuberculosis and HAART therapy.BMC Bioinformatics. 2010 Jan 18;11 Suppl 1(Suppl 1):S67. doi: 10.1186/1471-2105-11-S1-S67. BMC Bioinformatics. 2010. PMID: 20122243 Free PMC article.
-
Encapsidation of Staufen-2 Enhances Infectivity of HIV-1.Viruses. 2021 Dec 8;13(12):2459. doi: 10.3390/v13122459. Viruses. 2021. PMID: 34960728 Free PMC article.
-
Stochastic models for virus and immune system dynamics.Math Biosci. 2011 Dec;234(2):84-94. doi: 10.1016/j.mbs.2011.08.007. Epub 2011 Sep 16. Math Biosci. 2011. PMID: 21945381 Free PMC article.
-
Monocytes contribute to differential immune pressure on R5 versus X4 HIV through the adipocytokine visfatin/NAMPT.PLoS One. 2012;7(4):e35074. doi: 10.1371/journal.pone.0035074. Epub 2012 Apr 6. PLoS One. 2012. PMID: 22493731 Free PMC article.
-
Understanding the HIV coreceptor switch from a dynamical perspective.BMC Evol Biol. 2009 Nov 30;9:274. doi: 10.1186/1471-2148-9-274. BMC Evol Biol. 2009. PMID: 19948048 Free PMC article.
References
-
- Gorry PR, Churchill M, Crowe SM, Cunningham AL, Gabuzda D. Pathogenesis of macrophage tropic HIV. Curr HIV Res. 2005;3:53–60. - PubMed
-
- Clevestig P, Maljkovic I, Casper C, Carlenor E, Lindgren S, Naver L, Bohlin AB, Fenyo EM, Leitner T, Ehrnst A. The X4 phenotype of HIV type 1 evolves from R5 in two children of mothers, carrying X4, and is not linked to transmission. AIDS Res Hum Retroviruses. 2005;21:371–378. - PubMed
-
- Gray L, Sterjovski J, Churchill M, Ellery P, Nasr N, Lewin SR, Crowe SM, Wesselingh SL, Cunningham AL, Gorry PR. Uncoupling coreceptor usage of human immunodeficiency virus type 1 (HIV-1) from macrophage tropism reveals biological properties of CCR5-restricted HIV-1 isolates from patients with acquired immunodeficiency syndrome. Virology. 2005;337:384–98. - PubMed
Publication types
MeSH terms
Substances
LinkOut - more resources
Full Text Sources
Medical
Research Materials
Miscellaneous
