. 2007 Sep;6(3):195-207.
doi: 10.1016/j.cmet.2007.08.001.

Adipose is a conserved dosage-sensitive antiobesity gene

Affiliations

Adipose is a conserved dosage-sensitive antiobesity gene

Jae Myoung Suh et al. Cell Metab. 2007 Sep.

Abstract

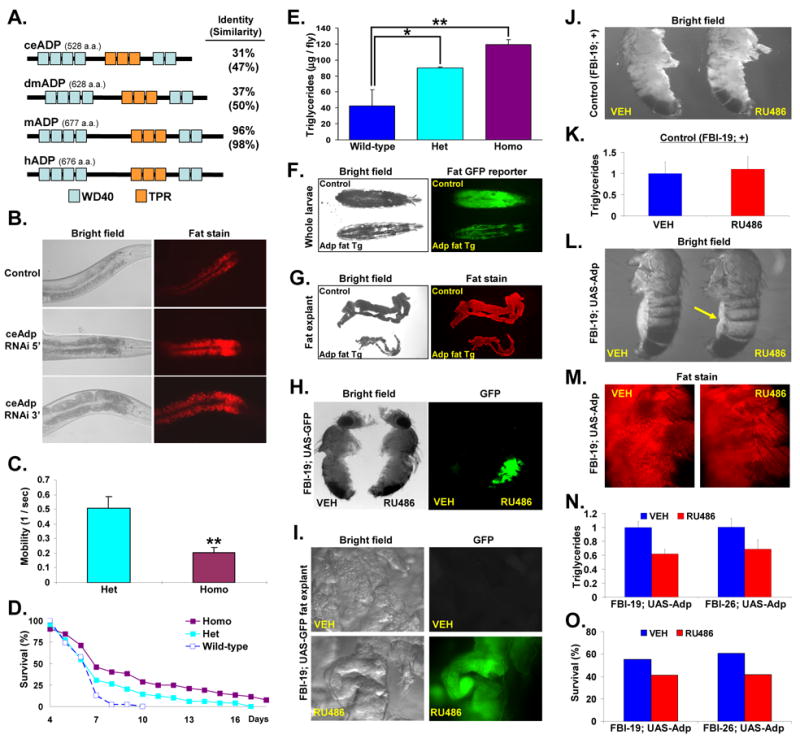
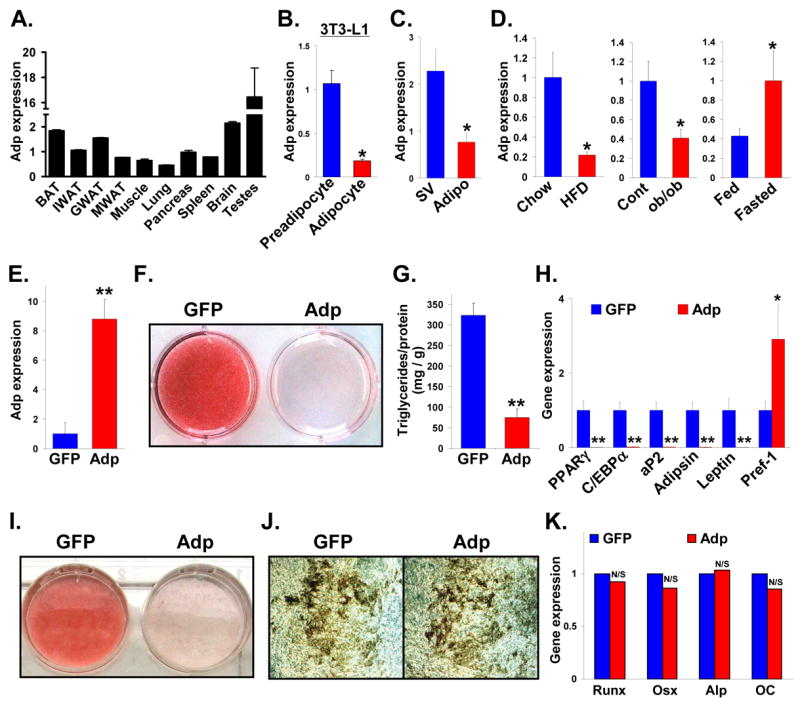
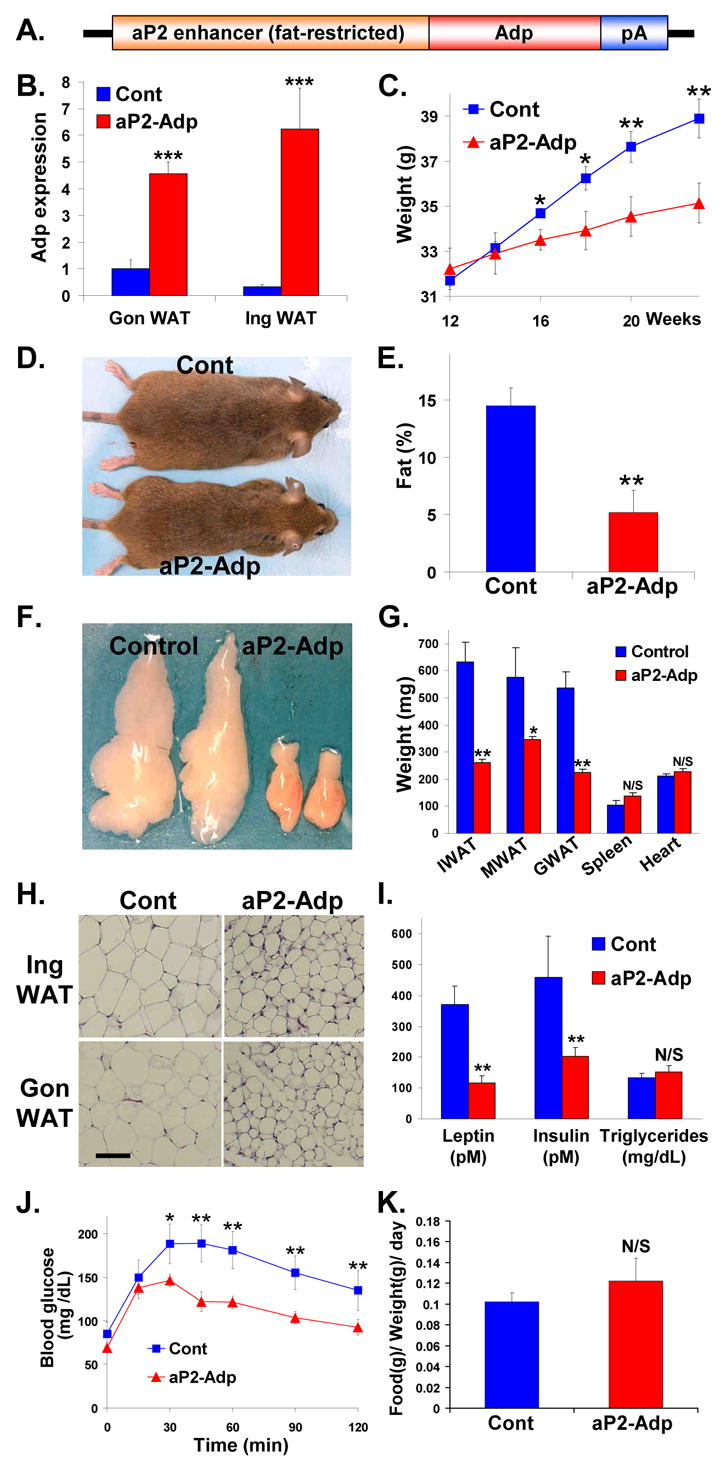
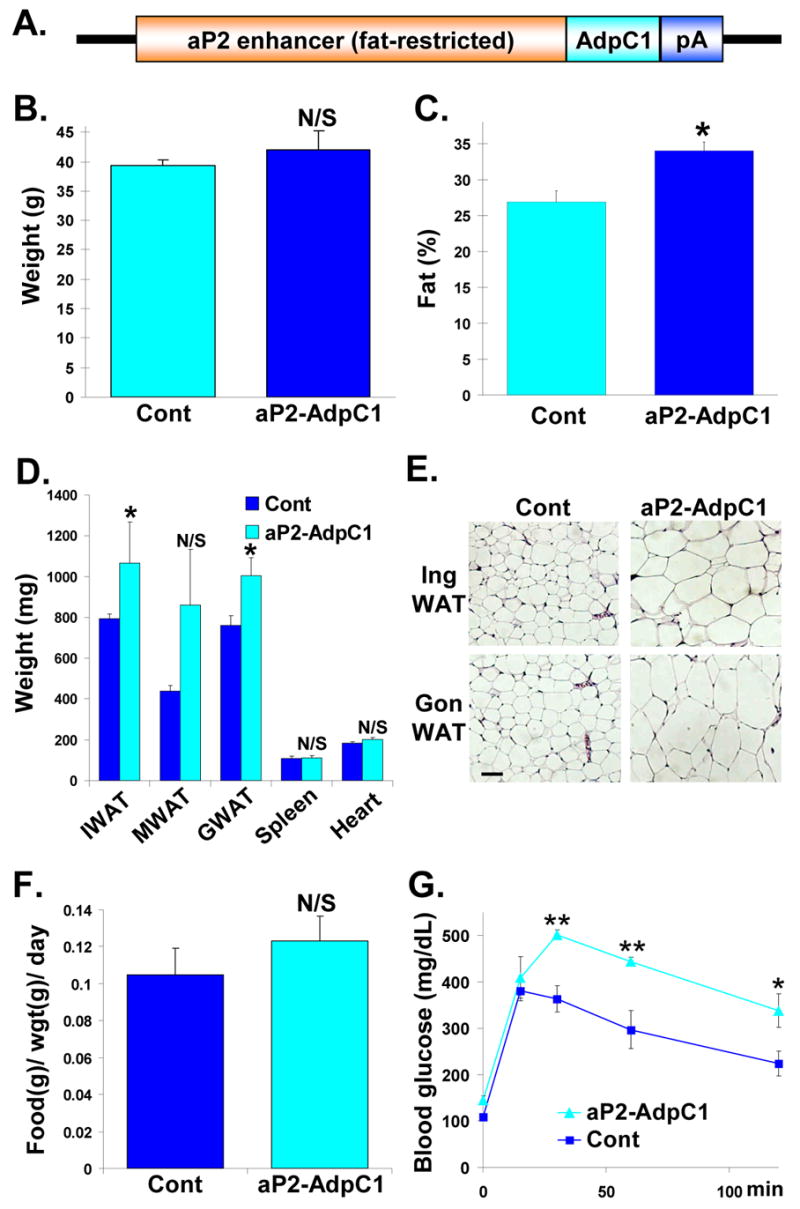
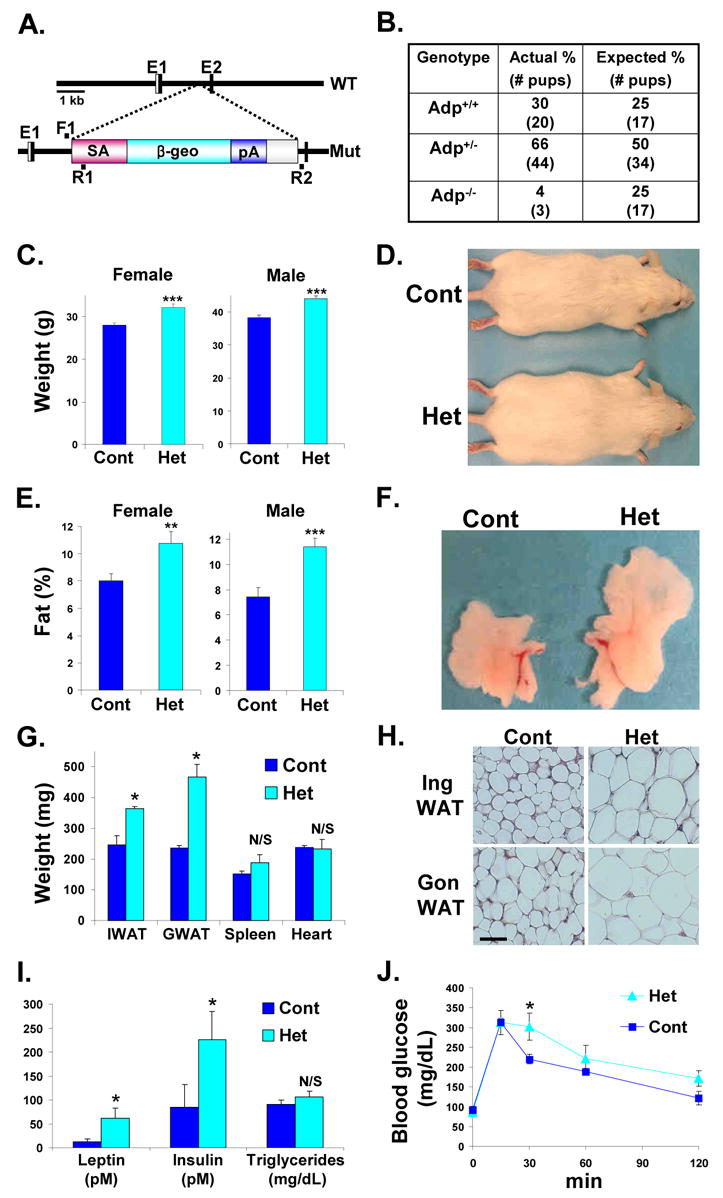
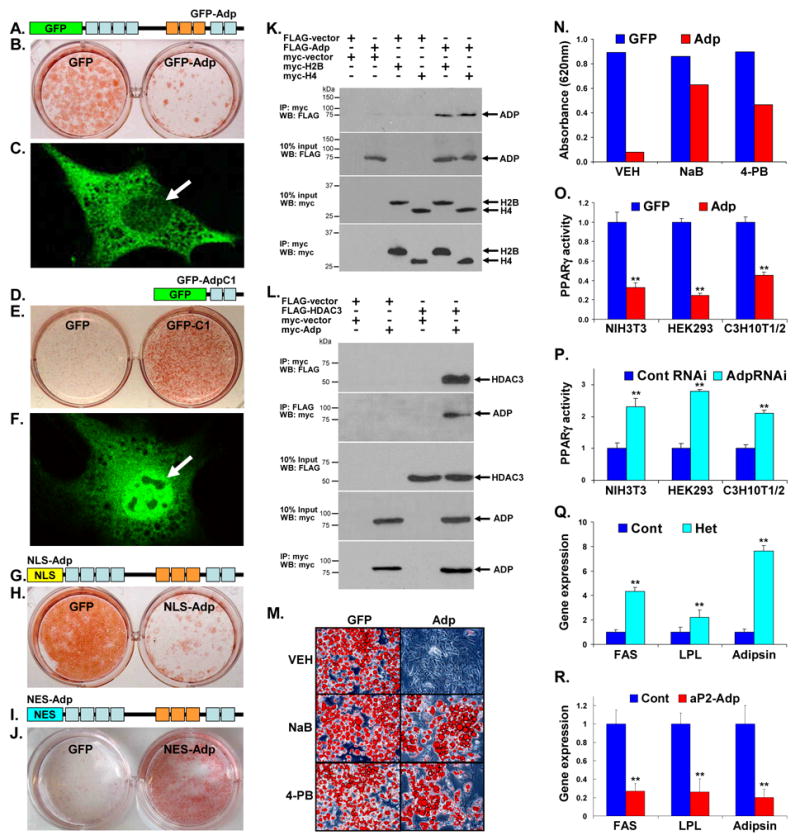
Adipose (Adp) is an evolutionarily conserved gene isolated from naturally occurring obese flies homozygous for an adp mutation. Here we show that the anti-obesity function of Adp (worm Y73E7A.9, fly adp, and murine Wdtc1) is conserved from worms to mammals. Further, Adp appears to inhibit fat formation in a dosage-sensitive manner. Adp heterozygous flies and Adp heterozygous mutant mice are obese and insulin resistant, as are mice that express a dominant negative form of Adp in fat cells. Conversely, fat-restricted Adp transgenic mice are lean and display improved metabolic profiles. A transient transgenic increase in Adp activity in adult fly fat tissues reduces fat accumulation, indicating therapeutic potential. ADP may elicit these anti-adipogenic functions by regulating chromatin dynamics and gene transcription, as it binds both histones and HDAC3 and inhibits PPARgamma activity. Thus Adp appears to be involved in an ancient pathway that regulates fat accumulation.


Figures

Figure 1
Figure 1. Inhibiting Adipose Stimulates Worm and Fly Fat Formation
(A) Alignment of worm (ce), fly (dm), mouse (m) and human (h) ADP protein. WD40 domains: light blue rectangles, TPR domains: orange rectangles. The percentages refer to comparison with hADP. (B) Progeny of control or Adp RNAi worms were examined with bright field microscopy in which increased opacity indicates more fat storage. Fat content was also assessed with Nile Red, a lipid-specific dye. Worms are at the same developmental stage. (C) Mobility of male adp+/− (Het) and adp−/− (Homo) flies was assessed in a negative geotaxis assay. Mobility is plotted as the inverse of time (seconds) required for flies to crawl a fixed distance. (D) Adp+/+ wild-type, adp+/− (Het), and adp−/− (Homo) male adult flies (n > 100) were deprived of food and survival was plotted. (E) Triglycerides were quantified from well-fed adult male adp+/+ wild-type, adp+/− (Het), and adp−/− (Homo) flies (n = 10 per genotype, averages from 4 experiments plotted). (F) Larvae expressing a fat body GFP reporter either alone (control) or with Adp fat body transgenesis were photographed under bright field (left) or GFP fluorescence (right) microscopy. (G) Fat body explants of larvae described in F were stained with Nile Red and photographed with bright field (left) or fluorescence (right) microscopy. (H, I) Adult fat body inducible (FBI)-GAL4; UAS-GFP male reporter flies were randomized to vehicle (VEH) or inducer (RU486) and then the whole fly (H) or fat body explants (I) were photographed. Wings and legs were removed in H for imaging. (J, K) Single transgenic FBI-19 male adult flies were treated with either vehicle or RU486 and photographed with light microscopy (J) or subjected to triglyceride quantitation and levels were normalized to vehicle-treated flies (K) (n = 10 per treatment, averages from 5 experiments plotted). Wings and legs were removed in J for photography. (L) Adult FBI-19-Adp male flies were treated with vehicle or RU486 and then photographed. Arrow indicates abdomen and the fat body, which appears smaller after RU486 treatment. Wings and legs were removed for imaging. (M) Flies described in L were stained with Nile Red and whole mounts were photographed. (N) Triglyceride quantification of male adult FBI-19-Adp and FBI-26-Adp flies treated with vehicle or RU486. Values were normalized to vehicle or RU486-treated single transgenic controls (n = 10 per treatment, averages from 5 experiments plotted). (O) Day 7 starvation survival of male adult FBI-19-Adp and FBI-26-Adp flies treated with vehicle or RU486 (n > 50). Similar results obtained for females in analyses performed in C–E and H–O. *p < 0.05; **p < 0.01; N/S not significant by t-test. Error bars indicate standard error of the mean (SEM).
Figure 2
Figure 2. Adp Inhibits Murine Adipogenesis
(A) qPCR analysis of Adp expression levels in various tissues from 4-month old ICR mice. Brown adipose tissue (BAT), inguinal white adipose tissue (IWAT), perigonadal white adipose tissue (GWAT), mesenteric white adipose tissue (MWAT) (B) 3T3-L1 cells were induced to form adipocytes and Adp levels were assessed with qPCR. (C) Adp expression was quantified with qPCR in stromal-vascular (SV) and adipocyte (Adipo) fractions. (D) Adp expression levels in adipose depots of littermates provided a normal or high fat diet (HFD) (left panel), genetically obese (ob/ob) fat depots compared to littermate controls (middle panel), or mice subjected to a 24-hour fast compared to fed controls (right panel). (E) Adp levels in 3T3-L1 cells infected with virus encoding GFP or Adp. (F–H) 3T3-L1 cells were infected with virus encoding GFP or Adp, adipogenically induced, and adipogenesis was evaluated with (F) Oil Red O staining (fat stains red), (G) triglyceride quantitation and (H) qPCR quantitation of the indicated markers. PPARγ and C/EBPα are adipogenic transcription factors; aP2 marks differentiated adipocytes; adipsin and leptin are adipokines expressed by mature adipocytes; Pref-1 is a preadipocyte marker. (I) NIH3T3 cells were infected with virus encoding GFP or Adp, adipogenically induced, and adipogenesis evaluated with Oil Red O staining. (J, K) MC3T3-E1 preosteoblastic cells were infected with GFP or Adp, osteogenically induced, and bone formation was assessed with (J) Von Kossa staining (bone stains black) or (K) qPCR of osteogenic markers. Runx2 (Runx) and Osterix (Osx) are osteogenic transcription factors, and alkaline phosphatase (Alp) and osteocalcin (OC) are bone differentiation markers. *p < 0.05, **p < 0.01; N/S not significant by t-test. Error bars represent SEM. β-actin serves as a loading control.
Figure 3
Figure 3. Fat-Selective Adp Transgenic Mice Are Lean and Insulin Sensitive
(A) aP2-Adp transgene. (B) qPCR analysis of Adp expression in fat pads removed from control and aP2-Adp transgenic littermates. (C) Weight curves of aP2-Adp transgenic mice and littermate controls (n = 8). (D) Photograph of a representative control (top) and aP2-Adp transgenic mouse (bottom). (E) NMR analyses of fat content of aP2-Adp transgenic mice and littermate controls (n = 8). (F) Photograph of representative perigonadal white adipose tissue (WAT) from control and aP2-Adp transgenics. (G) Average weights of inguinal (I), mesenteric (M), and perigonadal (G) WAT depots and the indicated organs from aP2-Adp transgenics and littermates. (n = 8). (H) Histological sections of inguinal (Ing) and perigonadal (Gon) WAT depots of control and aP2-Adp transgenic mice. (I) Analyses of average leptin, insulin, and triglyceride levels in plasma taken from aP2-Adp transgenic mice and littermates (n = 8). (J) GTTs of aP2-Adp transgenics mice and control littermates. (K) Food consumption was measured and plotted as the average of the indicated littermate control and aP2-Adp transgenic cohorts (n = 8). D–K studies performed at 6 months of age. *p < 0.05, **p < 0.01, ***p < 0.005; N/S not significant by t-test. Error bars indicate SEM.
Figure 4
Figure 4. Inhibiting Adp Stimulates Mammalian Adipogenesis
(A–D) NIH3T3s stably expressing either control RNAi or Adp RNAi were evaluated with (A) Adp qPCR (B) Oil Red O staining, (C) triglyceride quantitation, and (D) qPCR molecular analyses as in Figure 3. (E) Cartoon showing Adp structure, the series of deletion mutants, and their effects on adipogenesis. FL = full-length. Red arrows indicate effect on adipogenesis. WD40 domains: light blue rectangles, TPR domains: orange rectangles. (F) NIH3T3 cells expressing either GFP or AdpC1 were stained with Oil Red O to assess fat storage. (G) GFP (−−), Adp, and increasing amounts of AdpC1 were introduced into 3T3-L1s and fat accumulation evaluated with Oil Red O (top) and triglyceride quantitation (bottom). Purple shows increasing concentration of AdpC1 while Adp (green) is kept constant. (H) Schema as in G, except in this case AdpC1 was held constant while Adp levels were varied. **p < 0.01; N/S not significant by t-test. Error bars represent SEM.
Figure 5
Figure 5. Fat-Selective Blockade of Adipose Produces Murine Obesity and Hyperglycemia
(A) aP2-AdpC1 construct. (B, C) Average weights (B) and average NMR fat content (C) of aP2-AdpC1 transgenic and non-transgenic founders (n = 10). (D) Average weights of inguinal (I), mesenteric (M), and perigonadal (G) WAT depots as well as the indicated organs from aP2-AdpC1 transgenic mice and littermate controls. (n = 10) (E) Histological analyses of control and aP2-AdpC1 inguinal (Ing, top) and perigonadal (Gon, bottom) WAT. (F) Food intake of aP2-AdpC1 transgenic mice and littermates. (G) GTTs of aP2-AdpC1 mice and control littermates. Analyses in panels B–G on 8-month old mice. *p < 0.05, **p < 0.01; N/S not significant by t-test. Error bars represent SEM.
Figure 6
Figure 6. Adp Heterozygous Mutant Mice Are Obese and Insulin Resistant
(A) Schema of the wild-type (WT) Adp locus and the mutant (Mut) Adp allele. Splice Acceptor (SA) and the lacZ-neomycin (β-geo) cassette were inserted and disrupt gene expression from the second exon (E2). The location of the genotyping primers (F1, R1, R2) are illustrated. (B) Genomic DNA was extracted from pups of multiple Adp+/− by Adp+/− intercrosses and genotyped for the presence of Adp mutant and wild-type alleles. (C) Average weights of littermate matched female (control n = 10 mice, Adp Het n = 12) and male (control n = 15, Adp, Het n = 20) cohorts. (D) Photograph of representative wild-type (Cont) and Adp+/− mice (Het). (E) Average fat content as assessed by NMR of littermate matched female (control n = 10 mice, Adp Het n = 12) and male (control n = 15, Adp Het n = 20) cohorts. (F) Photograph of representative perigonadal white adipose tissue (WAT) explants from sibling wild-type (Cont) and Adp+/− (Het). (G) Average weights of inguinal (I) and perigonadal (G) WAT and indicated organs of wild-type and Adp heterozygous littermates. (H) Histological analyses of inguinal (Ing) and perigonadal (Gon) WAT. (I) Plasma of control and Adp heterozygous cohorts was analyzed for leptin, insulin and triglyceride levels. (J) GTTs of Adp heterozygous and control siblings (n = 8). Analyses in panels C–J done on 4-month old mice. *p < 0.05, **p < 0.01, ***p < 0.005 by t-test. N/S not significant. Error bars indicate SEM.
Figure 7
Figure 7. ADP Functions in the Nucleus and Interacts with a Corepressor Complex
(A) GFP-Adp chimera. WD40 domains: light blue rectangles, TPR domains: orange rectangles, GFP: green rectangle (B) 3T3-L1s were infected with virus containing either GFP or GFP-Adp, adipogenically induced and Oil Red O stained. (C) GFP-Adp was introduced into cells and its localization was assessed with confocal microscopy. White arrow indicates nucleus. (D) GFP-AdpC1 chimera. (E) NIH3T3s were infected with GFP or GFP-AdpC1 and adipogenesis was assessed with Oil Red O staining. (F) Confocal microscopic photograph of GFP-AdpC1 expressing cells. White arrow designates nucleus. (G) Nuclear localization signal (NLS)-Adp chimera. NLS: yellow rectangle. (H) 3T3-L1s were infected with virus encoding GFP or NLS-Adp, adipogenically induced, and stained with Oil Red O. (I) Nuclear export signal (NES)-Adp chimera. NES: aqua rectangle (J) 3T3-L1s were infected with GFP or NES-Adp virus, cultured in media supplemented with insulin, and then stained with Oil Red O. (K) HEK293s were transfected with a FLAG vector, a myc vector, FLAG-Adp, myc-H2B, or myc-H4 as indicated. After the cells were lysed, part of the homogenates was removed (input) and the remainder immunoprecipitated (IP) with anti-myc antibody. The resultant immunoprecipitates were subjected to Western blots (WB) against the FLAG tag (top panel) or the myc tag (bottom panel). 10% of the homogenate was also evaluated with Western blots using the indicated antibodies. (L) HEK293s were transfected with a FLAG vector, a myc vector, FLAG-HDAC3, or myc-Adp. The cells were lysed, part of the homogenates was removed and the remainder divided and immunoprecipitated with antibodies directed against either the myc or FLAG epitopes. The resultant immunoprecipitates were subjected to Western blots against the other tag (top two panels). The homogenates were also directly evaluated with Western blots as indicated. Bottom panel is the myc immunoprecipitates Western blotted with myc antisera. (M) 3T3-L1s expressing either GFP or Adp were adipogenically induced in the presence of vehicle (VEH) or 1.5 mM of HDAC inhibitors sodium butyrate (NaB) or 4-phenylbutyrate (4-PB), and then stained with Oil Red O. (N) The Oil Red O stain of cells in M was extracted and quantified by measuring absorbance (620nm). (O) PPARγ luciferase assay: GFP or Adp along with PPARγ, a PPRE-luc reporter, and a renilla luciferase control were transfected into the indicated cell lines and luciferase activity was measured and then standardized with renilla. These normalized values were plotted as PPARγ activity. (P) The indicated cell lines, expressing control RNAi or Adp RNAi together with PPARγ, PPRE-luc, and renilla, were assayed for luciferase activity as in O. (Q, R) qPCR analyses of PPARγ target gene expression in gonadal fat of (Q) control and Adp heterozygous mice or (R) control and aP2-Adp transgenic mice. FAS fatty acid synthase, LPL lipoprotein lipase, **p < 0.01.

Similar articles

Cited by

References

    1. Ashrafi K, Chang FY, Watts JL, Fraser AG, Kamath RS, Ahringer J, Ruvkun G. Genome-wide RNAi analysis of Caenorhabditis elegans fat regulatory genes. Nature. 2003;421:268–272. - PubMed
    1. Blatch GL, Lassle M. The tetratricopeptide repeat: a structural motif mediating protein-protein interactions. Bioessays. 1999;21:932–939. - PubMed
    1. Bluher M, Kahn BB, Kahn CR. Extended longevity in mice lacking the insulin receptor in adipose tissue. Science. 2003;299:572–574. - PubMed
    1. Campbell P, Dhand R. Obesity. Nature. 2000;404:631–671.
    1. Cerna D, Wilson DK. The structure of Sif2p, a WD repeat protein functioning in the SET3 corepressor complex. J Mol Biol. 2005;351:923–935. - PubMed

Publication types

MeSH terms