

HIF activation and VEGF overexpression are coupled with ZO-1 up-phosphorylation in the brain of dystrophic mdx mouse
- PMID: 17784876
- PMCID: PMC8095599
- DOI: 10.1111/j.1750-3639.2007.00090.x
HIF activation and VEGF overexpression are coupled with ZO-1 up-phosphorylation in the brain of dystrophic mdx mouse
Abstract
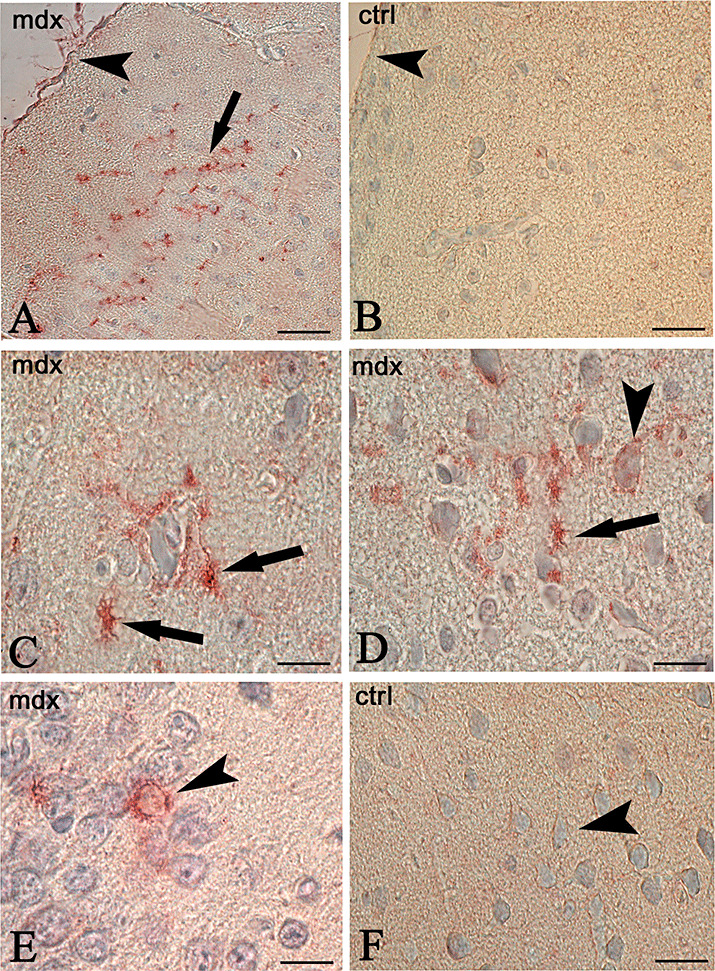
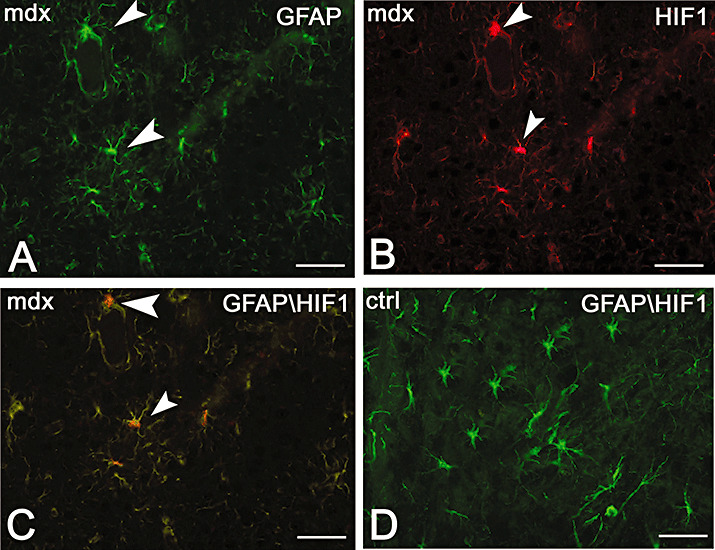
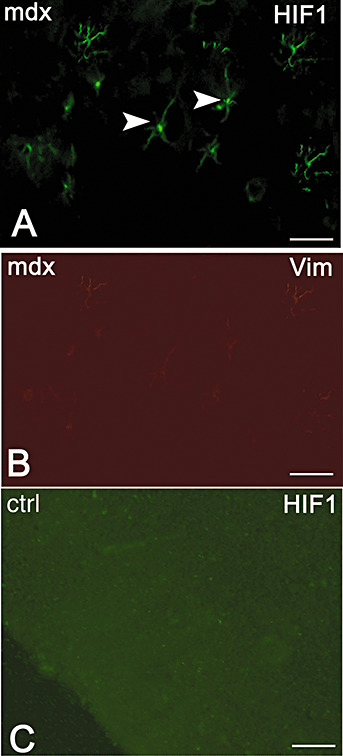
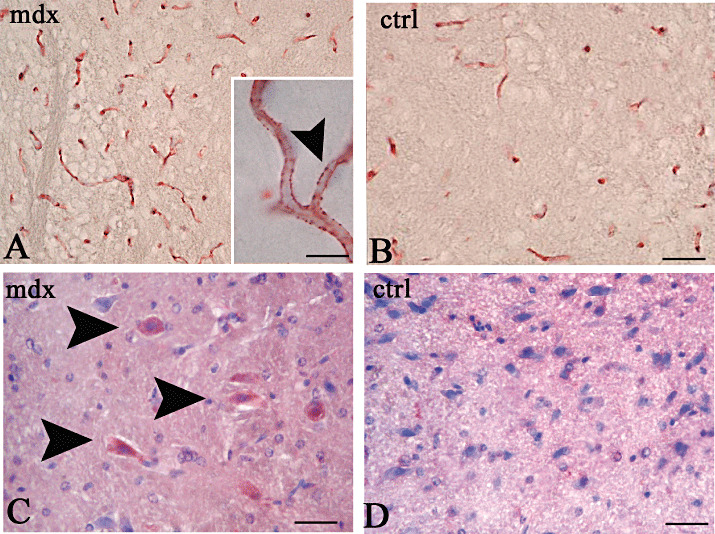
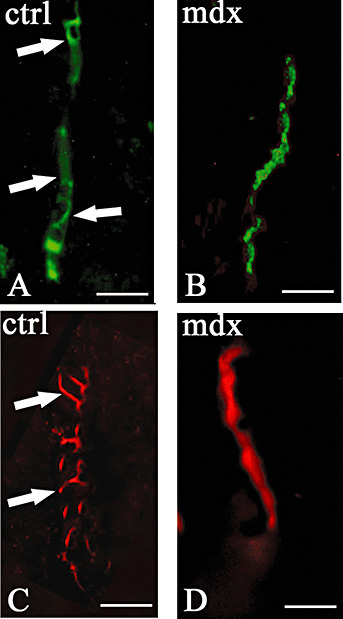
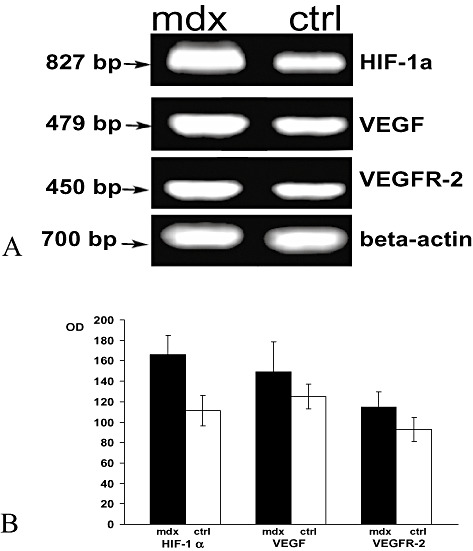
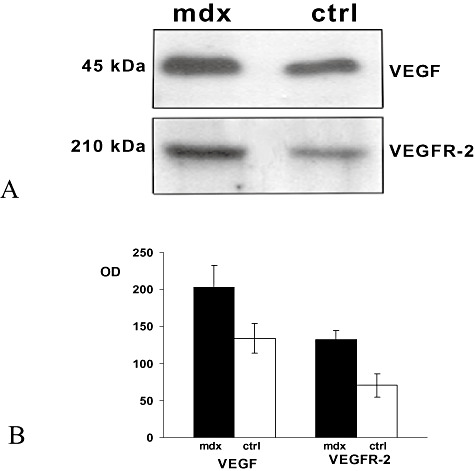
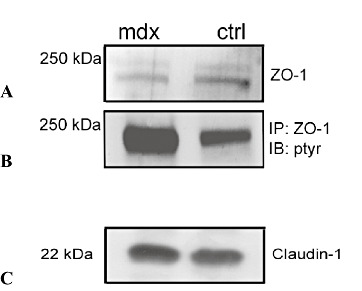
In Duchenne muscular dystrophy (DMD) metabolic and structural alterations of the central nervous system are described. Here, we investigated in the brain of 10 mdx mice and in five control ones, the expression of hypoxia inducible factor-1alpha (HIF-1alpha) and we correlated it with the expression of vascular endothelial growth factor (VEGF) and vascular endothelial growth factor receptor-2 (VEGFR-2) and of the endothelial tight junction proteins zonula occludens-1 (ZO-1) and claudin-1. Results showed an activation of mRNA HIF-1alpha by reverse transcription polymerase chain reaction (RT-PCR) and a strong HIF1-alpha labeling of perivascular glial cells and cortical neurons by immunohistochemistry, in mdx mouse. Moreover, overexpression of VEGF and VEGFR-2, respectively, in neurons and in endothelial cells coupled with changes to endothelial ZO-1 and claudin-1 expression in the latter were detected by immunoblotting and immunohistochemistry, in the mdx brain. Furthermore, by immunoprecipitation, an up-phosphorylation of ZO-1 was demonstrated in mdx endothelial cells in parallel with the reduction in ZO-1 protein content. These data suggest that the activation of HIF-1alpha in the brain of dystrophic mice coupled with VEGF and VEGFR-2 up-regulation and ZO-1 and claudin-1 rearrangement might contribute to both blood-brain barrier opening and increased angiogenesis.
Figures
Similar articles
-
Severe alterations of endothelial and glial cells in the blood-brain barrier of dystrophic mdx mice.Glia. 2003 May;42(3):235-51. doi: 10.1002/glia.10216. Glia. 2003. PMID: 12673830
-
Increased matrix-metalloproteinase-2 and matrix-metalloproteinase-9 expression in the brain of dystrophic mdx mouse.Neuroscience. 2006 Jul 7;140(3):835-48. doi: 10.1016/j.neuroscience.2006.02.077. Epub 2006 May 2. Neuroscience. 2006. PMID: 16650610
-
α-Methyl-prednisolone normalizes the PKC mediated brain angiogenesis in dystrophic mdx mice.Brain Res Bull. 2019 Apr;147:69-77. doi: 10.1016/j.brainresbull.2019.01.023. Epub 2019 Jan 31. Brain Res Bull. 2019. PMID: 30711624
-
Blood-brain barrier alterations in MDX mouse, an animal model of the Duchenne muscular dystrophy.Curr Neurovasc Res. 2005 Jan;2(1):47-54. doi: 10.2174/1567202052773481. Curr Neurovasc Res. 2005. PMID: 16181099 Review.
-
Intracranial meningiomas, the VEGF-A pathway, and peritumoral brain oedema.Dan Med J. 2013 Apr;60(4):B4626. Dan Med J. 2013. PMID: 23651727 Review.
Cited by
-
Glial and endothelial blood-retinal barrier responses to amyloid-beta in the neural retina of the rat.Clin Ophthalmol. 2008 Dec;2(4):801-16. doi: 10.2147/opth.s3967. Clin Ophthalmol. 2008. PMID: 19668434 Free PMC article.
-
Cardiomyopathy in the mouse model of Duchenne muscular dystrophy caused by disordered secretion of vascular endothelial growth factor.Med Sci Monit. 2011 Nov;17(11):BR332-338. doi: 10.12659/msm.882043. Med Sci Monit. 2011. PMID: 22037736 Free PMC article.
-
Hypoxic oligodendrocyte precursor cell-derived VEGFA is associated with blood-brain barrier impairment.Acta Neuropathol Commun. 2023 Aug 7;11(1):128. doi: 10.1186/s40478-023-01627-5. Acta Neuropathol Commun. 2023. PMID: 37550790 Free PMC article.
-
ANG1 treatment reduces muscle pathology and prevents a decline in perfusion in DMD mice.PLoS One. 2017 Mar 23;12(3):e0174315. doi: 10.1371/journal.pone.0174315. eCollection 2017. PLoS One. 2017. PMID: 28334037 Free PMC article.
-
Brain-specific deletion of extracellular signal-regulated kinase 2 mitogen-activated protein kinase leads to aberrant cortical collagen deposition.Am J Pathol. 2009 Dec;175(6):2586-99. doi: 10.2353/ajpath.2009.090130. Epub 2009 Nov 5. Am J Pathol. 2009. PMID: 19893051 Free PMC article.
References
-
- Anderson JL, Head SI, Rae C, Morley JW (2002) Review. Brain function in Duchenne muscular dystrophy. Brain 125:4–13. - PubMed
-
- Antonetti DA, Barber AJ, Hollinger LA, Wolpert EB, Gardner TW (1999) Vascular endothelial growth factor induces rapid phosphorylation of tight junction proteins occludin and zonula occludens 1. A potential mechanism for vascular permeability in diabetic retinopathy and tumors. J Biol Chem 274:23463–23467. - PubMed
-
- Balda MS, Gonzalez‐Mariscal L, Contreras RG, Macias‐Silva M, Torres‐Marquez ME, Garcia‐Sainz JA, Cereijido M (1991) Assembly and sealing of tight junctions: possible participation of G‐proteins, phospholipase C, protein kinase C and calmodulin. J Membr Biol 122:193–202. - PubMed
-
- Baydur A, Gilgott I, Trentice W, Carlson M, Fisher DA (1990) Decline in respiratory function and experience with long term assisted ventilation in advanced Duchenne’s muscular dystrophy. Chest 97:884–889. - PubMed
-
- Breier G, Albrecht U, Sterrer S, Risau W (1992) Expression of vascular endothelial growth factor during embryonic angiogenesis and endothelial cell differentiation. Development 114:521–532. - PubMed
