. 2007 Sep 6;55(5):799-808.
doi: 10.1016/j.neuron.2007.07.037.

Specialized circuits from primary visual cortex to V2 and area MT

Affiliations

Specialized circuits from primary visual cortex to V2 and area MT

Jonathan J Nassi et al. Neuron. .

Abstract

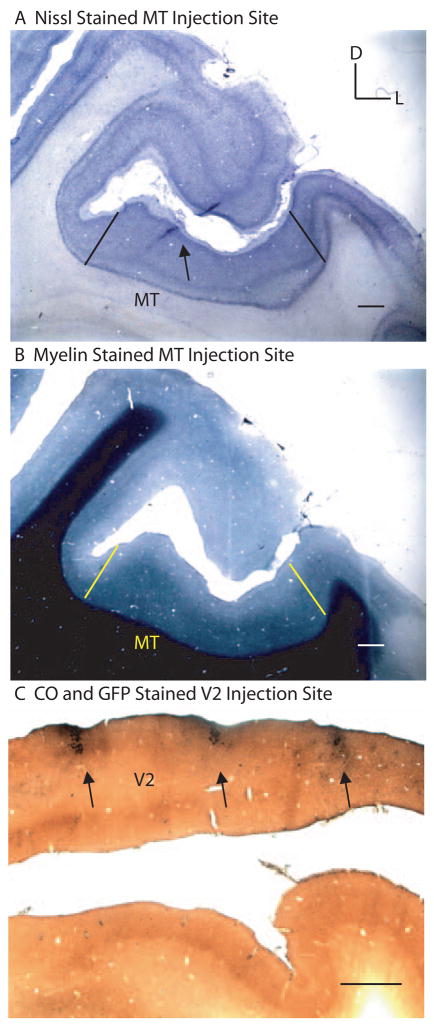
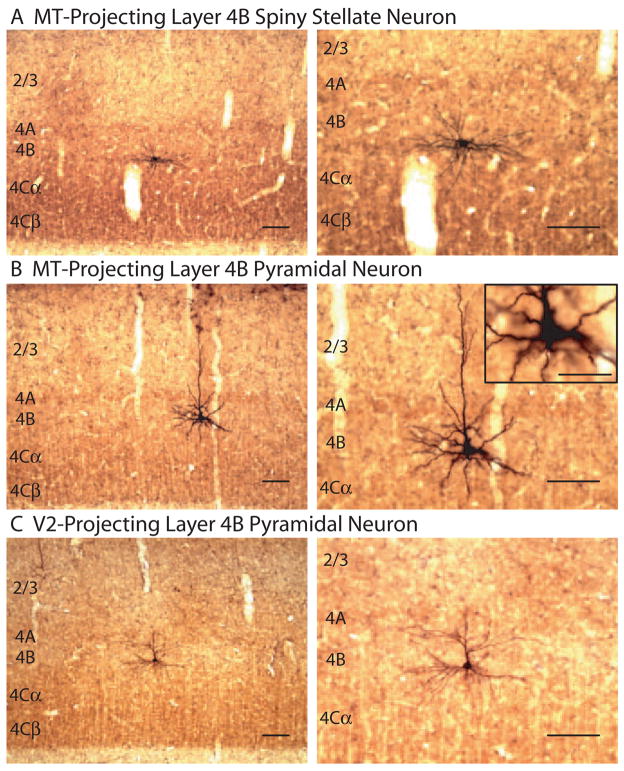
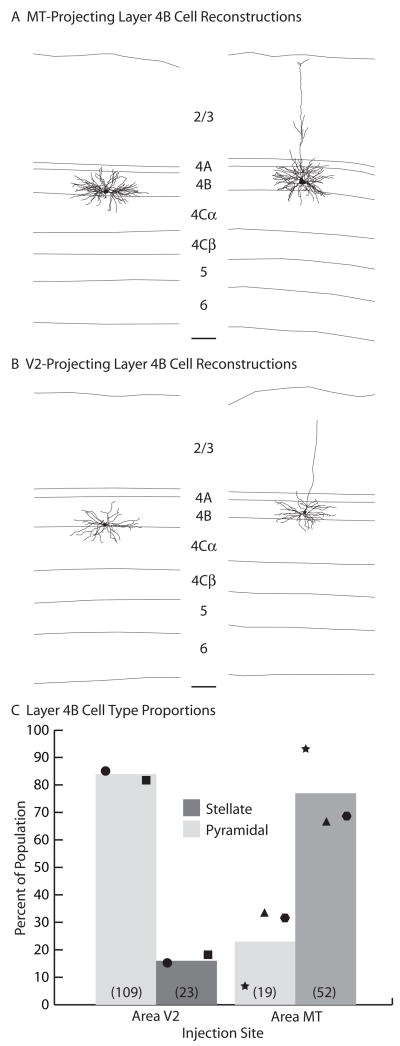
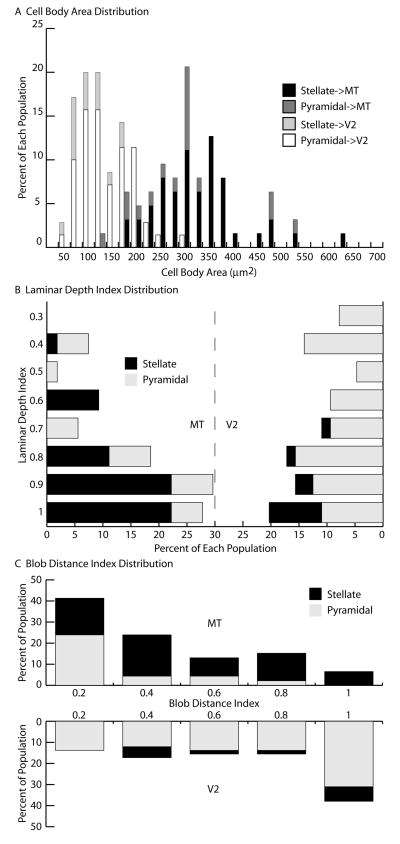
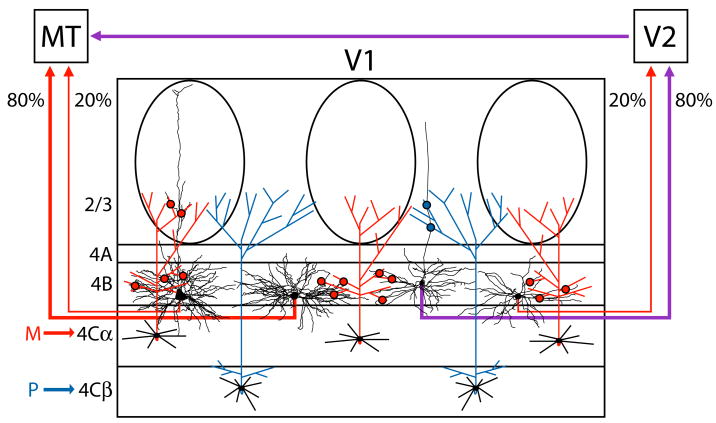
Primary visual cortex recombines inputs from magnocellular (M) and parvocellular (P) streams to create functionally specialized outputs. Understanding these input-output relationships is complicated by the fact that layer 4B, which provides outputs to dorsal visual areas, contains multiple cell types. Using a modified rabies virus that expresses green fluorescent protein, we show that layer 4B neurons projecting to MT are a majority spiny stellate, whereas those projecting to V2 are overwhelmingly pyramidal. Regardless of cell type, MT-projecting neurons have larger cell bodies, more dendritic length, and are deeper within layer 4B. Furthermore, MT-projecting pyramidal neurons are located preferentially underneath cytochrome oxidase blobs, indicating that MT-projecting neurons of both types restrict their dendrites to M-recipient zones. We conclude that MT-projecting layer 4B neurons are specialized for the fast transmission of information from the M pathway, while V2-projecting neurons are likely to mediate slower computations involving mixed M and P signals.


Figures

Figure 1
Figure 1. Rabies virus injection sites in MT or V2. (A)
A single coronally cut cortical section stained for Nissl showing the needle track location (black arrow) within the STS. Black lines denote the approximate lateral and medial borders of MT as determined by myelin. (B) A coronally cut cortical section, adjacent to that in (A), stained for myelin. Yellow lines denote the approximate lateral and medial borders of the uniformly dense myelination pattern typical of MT. D, dorsal; L, lateral. Scale bars in (A) and (B) equal 100μm. (C) A single coronally cut cortical section stained for cytochrome oxidase (CO; brown) and GFP (black) showing the locations of rabies injected regions (black arrows) along the opercular surface in V2. Scale bar equals 1mm.
Figure 2
Figure 2. Retrogradely labeled neurons in layer 4B of V1 after injections in MT or V2.
(A and B) Parasagittal sections stained for CO and GFP showing a spiny stellate neuron (A) or pyramidal neuron (B) in layer 4B of V1 retrogradely labeled from MT. (C) A coronal section stained for CO and GFP showing a pyramidal neuron in layer 4B of V1 retrogradely labeled from V2. Low (left) and high (right) magnification images are shown with cortical layers indicated. A single higher magnification image is shown in the inset of (B). Scale bars in (A) and (C) equal 100 μm. Scale bar in inset of (B) equals 50μm.
Figure 3
Figure 3. Cell types projecting from layer 4B of V1 to MT or V2
(A and B) Computer-assisted dendritic reconstructions of spiny stellate (left) and pyramidal (right) neurons projecting to MT (A) or V2 (B). Layers are indicated. Scale bars equal 100μm. (C) The average percentages of spiny stellate (dark gray) and pyramidal (light gray) neurons projecting to MT or V2. Cases JNM2 (star), JNM14L (triangle), and JNM14R (hexagon) for MT, and JNM8 (circle) and JNM12 (square) for V2 are shown. Total numbers of each cell type are indicated in parentheses.
Figure 4
Figure 4. Anatomical differences between V1 neurons projecting to MT or V2. (A)
Percentages of layer 4B spiny stellate (black) and pyramidal (dark gray) neurons projecting to MT or spiny stellate (light gray) and pyramidal (white) neurons projecting to V2 according to their cell body area. (B) Percentages of layer 4B spiny stellate (black) and pyramidal (gray) neurons projecting to MT (left) or V2 (right) according to their laminar depth index. An index value of 1 indicates a neuron at the bottom of layer 4B and an index value of 0 indicates a neuron at the top of layer 4B. (C) Percentages of layer 4B spiny stellate (black) and pyramidal (gray) neurons projecting to MT (top) or V2 (bottom) according to their blob distance index. An index value of 1 indicates a neuron centered in an interblob equidistant from the two closest blobs and an index value of 0 indicates a neuron centered directly underneath a blob.
Figure 5
Figure 5. Specialized circuits from V1 to V2 and area MT
Schematic of circuits carrying M and P inputs to MT or V2, through layers 4C and 4B of V1. Both spiny stellates (80%, middle-left) and pyramids (20%, far left) that project from V1 to MT restrict their dendrites to zones receiving M input (red arrow) via layer 4Cα neurons (red axons). These zones include layer 4B and the overlying CO blobs of layer 2/3. The projection from layer 4B of V1 to MT is, therefore, dominated by the M pathway (red arrows). In contrast, the majority of layer 4B neurons that project to V2 are pyramids (80%, middle-right) located underneath both blobs and interblobs. These neurons integrate both P input (blue arrow) via layer 4Cβ neurons (blue axons) and M input (red arrow) via layer 4Cα neurons (red axons) to provide a combined M and P projection to V2 and indirectly to MT (purple arrows). The minority spiny stellates (20%, far right) that project to V2 provide a weak M input (red arrow). Dendrites are shown in black. The locations of putative synaptic contacts from axons of layer 4Cα neurons onto dendrites of layer 4B neurons are schematized by red dots and those from layer 4Cβ neurons by blue dots. Layer 4B neurons are computer reconstructions taken from Figure 3. Layers are indicated.

References

    1. Barone P, Dehay C, Berland M, Bullier J, Kennedy H. Developmental remodeling of primate visual cortical pathways. Cereb Cortex. 1995;5:22–38. - PubMed
    1. Blasdel GG, Lund JS. Termination of afferent axons in macaque striate cortex. J Neurosci. 1983;3:1389–1413. - PMC - PubMed
    1. Boyd JD, Casagrande VA. Relationships between cytochrome oxidase (CO) blobs in primate primary visual cortex (V1) and the distribution of neurons projecting to the middle temporal area (MT) J Comp Neurol. 1999;409:573–591. - PubMed
    1. Burkhalter A, Felleman DJ, Newsome WT, Van Essen DC. Anatomical and physiological asymmetries related to visual areas V3 and VP in macaque extrastriate cortex. Vision Res. 1986;26:63–80. - PubMed
    1. Callaway EM. Local circuits in primary visual cortex of the macaque monkey. Annu Rev Neurosci. 1998a;21:47–74. - PubMed

Publication types

MeSH terms

Substances

LinkOut - more resources