

Assessing the impacts of agricultural intensification on biodiversity: a British perspective
- PMID: 17785274
- PMCID: PMC2610109
- DOI: 10.1098/rstb.2007.2183
Assessing the impacts of agricultural intensification on biodiversity: a British perspective
Abstract
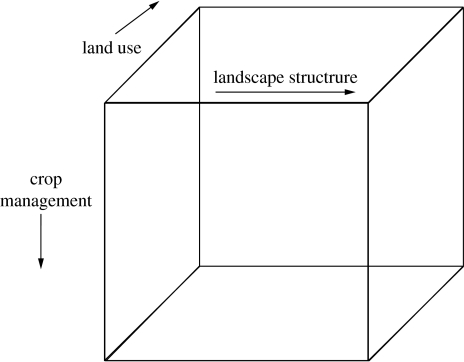
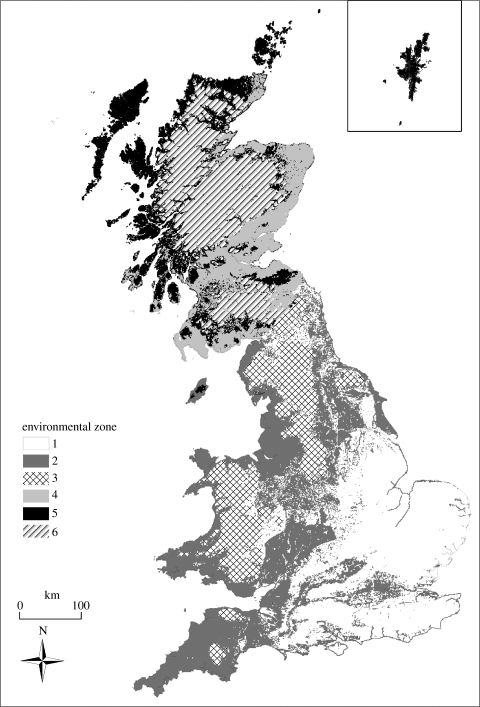
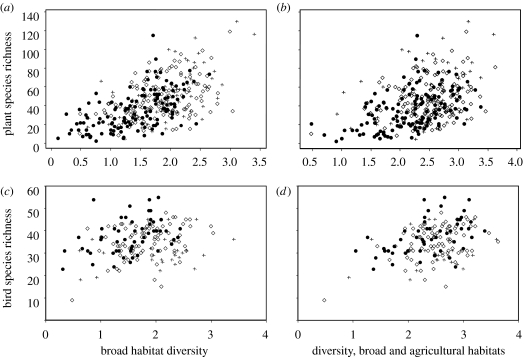
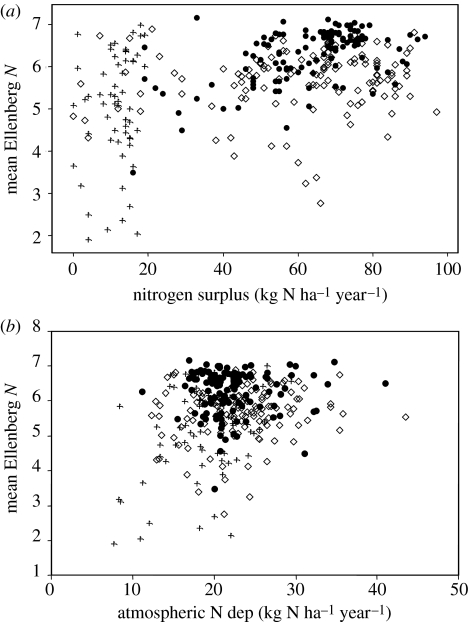
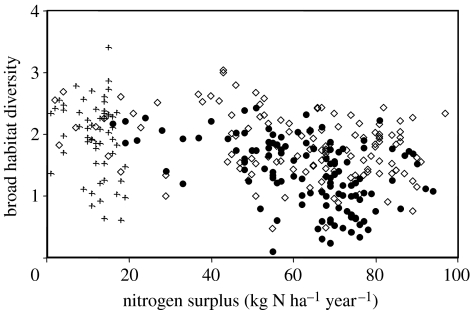
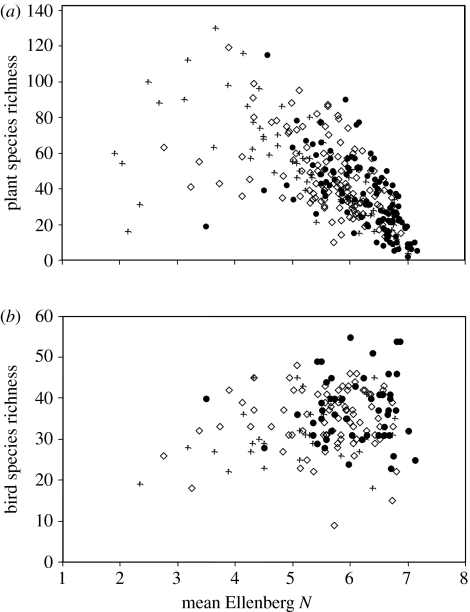
Agricultural intensification is best considered as the level of human appropriation of terrestrial net primary production. The global value is set to increase from 30%, increasing pressures on biodiversity. The pressures can be classified in terms of spatial scale, i.e. land cover, landscape management and crop management. Different lowland agricultural landscapes in Great Britain show differences among these pressures when habitat diversity and nutrient surplus are used as indicators. Eutrophication of plants was correlated to N surplus, and species richness of plants correlated with broad habitat diversity. Bird species diversity only correlated with habitat diversity when the diversity of different agricultural habitats was taken into account. The pressures of agricultural change may be reduced by minimizing loss of large habitats, minimizing permanent loss of agricultural land, maintaining habitat diversity in agricultural landscapes in order to provide ecosystem services, and minimizing pollution from nutrients and pesticides from the crops themselves. While these pressures could potentially be quantified using an internationally consistent set of indicators, their impacts would need to be assessed using a much larger number of locally applicable biodiversity indicators.
Figures
Similar articles
-
The importance of agricultural lands for Himalayan birds in winter.Conserv Biol. 2017 Apr;31(2):416-426. doi: 10.1111/cobi.12812. Epub 2016 Nov 10. Conserv Biol. 2017. PMID: 27558794
-
Homogenizing and diversifying effects of intensive agricultural land-use on plant species beta diversity in Central Europe - A call to adapt our conservation measures.Sci Total Environ. 2017 Jan 15;576:225-233. doi: 10.1016/j.scitotenv.2016.10.106. Epub 2016 Oct 24. Sci Total Environ. 2017. PMID: 27788437
-
Even the smallest non-crop habitat islands could be beneficial: distribution of carabid beetles and spiders in agricultural landscape.PLoS One. 2015 Apr 10;10(4):e0123052. doi: 10.1371/journal.pone.0123052. eCollection 2015. PLoS One. 2015. PMID: 25859850 Free PMC article.
-
Biodiversity conservation and agricultural sustainability: towards a new paradigm of 'ecoagriculture' landscapes.Philos Trans R Soc Lond B Biol Sci. 2008 Feb 12;363(1491):477-94. doi: 10.1098/rstb.2007.2165. Philos Trans R Soc Lond B Biol Sci. 2008. PMID: 17652072 Free PMC article. Review.
-
Small things are important: the value of singular point elements for birds in agricultural landscapes.Biol Rev Camb Philos Soc. 2021 Aug;96(4):1386-1403. doi: 10.1111/brv.12707. Epub 2021 Mar 10. Biol Rev Camb Philos Soc. 2021. PMID: 33694303
Cited by
-
Pesticide Exposure in Relation to the Incidence of Abnormal Glucose Regulation: A Retrospective Cohort Study.Int J Environ Res Public Health. 2022 Jun 20;19(12):7550. doi: 10.3390/ijerph19127550. Int J Environ Res Public Health. 2022. PMID: 35742799 Free PMC article.
-
Effects of Farming Systems on Insect Communities in the Paddy Fields of a Simplified Landscape During a Pest-control Intervention.Zool Stud. 2021 Sep 16;60:e56. doi: 10.6620/ZS.2021.60-56. eCollection 2021. Zool Stud. 2021. PMID: 35665080 Free PMC article.
-
Livestock grazing impact differently on the functional diversity of dung beetles depending on the regional context in subtropical forests.Sci Rep. 2022 Jan 31;12(1):1636. doi: 10.1038/s41598-022-05616-x. Sci Rep. 2022. PMID: 35102229 Free PMC article.
-
Landscape heterogeneity rather than crop diversity mediates bird diversity in agricultural landscapes.PLoS One. 2018 Aug 1;13(8):e0200438. doi: 10.1371/journal.pone.0200438. eCollection 2018. PLoS One. 2018. PMID: 30067851 Free PMC article.
-
Regionalizing land use impacts on farmland birds.Environ Monit Assess. 2015 Jun;187(6):336. doi: 10.1007/s10661-015-4448-z. Epub 2015 May 9. Environ Monit Assess. 2015. PMID: 25957192 Free PMC article.
References
-
- Anon. Curbs on panic and pesticides (editorial article) Nature. 1969;224:1249. doi:10.1038/2241249a0 - DOI - PubMed
-
- Barr, C. J. et al 1993 Countryside survey 1990 main report. Countryside 1990. Department of the Environment, London, UK.
-
- Benton T.G, Vickery J.A, Wilson J.D. Farmland biodiversity: is habitat heterogeneity the key? Trends Ecol. Evol. 2003;18:182–188. doi:10.1016/S0169-5347(03)00011-9 - DOI
-
- Bradbury R.B, Kirby W.B. Farmland birds and resource protection in the UK: cross-cutting solutions for multi-functional farming? Biol. Conserv. 2006;129:530–542. doi:10.1016/j.biocon.2005.11.020 - DOI
-
- Bunce R.G.H, Barr C.J, Clarke R.T, Howard D.C, Lane M.J. Land classification for strategic environmental survey. J. Environ. Manage. 1996;47:37–60. doi:10.1006/jema.1996.0034 - DOI
Publication types
MeSH terms
Substances
LinkOut - more resources
Full Text Sources
