. 2007 Oct 16;104(42):16416-21.
doi: 10.1073/pnas.0703874104. Epub 2007 Sep 4.

East African megadroughts between 135 and 75 thousand years ago and bearing on early-modern human origins

Affiliations

East African megadroughts between 135 and 75 thousand years ago and bearing on early-modern human origins

Christopher A Scholz et al. Proc Natl Acad Sci U S A. .

Abstract

The environmental backdrop to the evolution and spread of early Homo sapiens in East Africa is known mainly from isolated outcrops and distant marine sediment cores. Here we present results from new scientific drill cores from Lake Malawi, the first long and continuous, high-fidelity records of tropical climate change from the continent itself. Our record shows periods of severe aridity between 135 and 75 thousand years (kyr) ago, when the lake's water volume was reduced by at least 95%. Surprisingly, these intervals of pronounced tropical African aridity in the early late-Pleistocene were much more severe than the Last Glacial Maximum (LGM), the period previously recognized as one of the most arid of the Quaternary. From these cores and from records from Lakes Tanganyika (East Africa) and Bosumtwi (West Africa), we document a major rise in water levels and a shift to more humid conditions over much of tropical Africa after approximately 70 kyr ago. This transition to wetter, more stable conditions coincides with diminished orbital eccentricity, and a reduction in precession-dominated climatic extremes. The observed climate mode switch to decreased environmental variability is consistent with terrestrial and marine records from in and around tropical Africa, but our records provide evidence for dramatically wetter conditions after 70 kyr ago. Such climate change may have stimulated the expansion and migrations of early modern human populations.


Conflict of interest statement

The authors declare no conflict of interest.

Figures
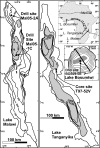
Fig. 1.
Fig. 1.
Study site locations in Africa. Bathymetric maps of Lakes Malawi, Tanganyika, and Bosumtwi showing locations of cores. Lake Bosumtwi contour interval, 10 m; solid line shows seismic profile location shown in Fig. 2. Shaded areas on Malawi and Tanganyika maps show the maximum extent of lowstand lakes described in text. (Upper Inset) Lake locations along with maximum northern and southern extent of the Intertropical Convergence Zone, as well as the location of Atlantic Ocean core GeoB 1016 (asterisk) on the Angola margin.
Fig. 2.
Fig. 2.
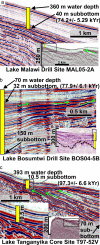
Cross-sections of shallow unconformities and drill sites. Yellow bars on seismic profiles indicate drilled extent at each location. (a) Lake Malawi site MAL05-2A. (b) Lake Bosumtwi site BOS04–5B. (c) Lake Tanganyika site T97-52V. (Insets) Full seismic profiles. Green arrows indicate reflection terminations diagnostic of subaerial exposure. Ages (kyr BP) of unconformities are shown in parentheses. (b Inset) The drill site location relative to annular moat of impact structure is shown; dashed line is the sediment-impact rock interface. See SI Text, SI Figs. 5–7, and SI Tables 1–3 for additional details.
Fig. 3.
Fig. 3.
Summary stratigraphy from three drill sites. Included are TOC, saturated bulk density, lithostratigraphy, and selected core imagery. (a) Lake Bosumtwi, West Africa (BOS04–5B). (b) Lake Malawi southern East Africa, (MAL05-2A). (c) Lake Tanganyika (T97-52V), southern East Africa. Red dashed lines indicate subbottom locations of each unconformity observed in the seismic data in Fig. 2. The unconformities are also reflected in the cores by reductions in TOC, increases in bulk density, and marked changes in lithostratigraphy. Radiocarbon dates (red asterisks) and infrared luminescence dates (blue asterisks) are shown above and below the unconformities (ages in kyr BP). See SI Text, SI Figs. 5 and 6, and SI Tables 1 and 2 for details of geochronology.
Fig. 4.
Fig. 4.
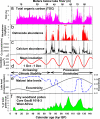
Summary Lake Malawi lake level indicators, with orbital forcing and marine records. (ac) Measurements from drill hole MAL-1C from the deep water (593 m) drill site. (a) TOC. High TOC values indicate highstand conditions, with predominantly laminated intervals, indicating bottom water anoxia. (b) Ostracode abundance, peaks with one asterisk indicate core intervals of profundal taxa, peaks with two asterisks indicate core intervals of littoral zone taxa, and lake shoreline close to the drill site. Ostracodes are only present when the lake is dramatically shallower, with oxygenated bottom waters. (c) Ca abundance, indicating intervals of calcium carbonate precipitation, which occurs during severe lowstands and periods of high salinity. See SI Text, SI Figs. 5 and 6, and SI Tables 1 and 2 for details of geochronology. (d) Mean insolation at 10 S° at the end of the dry season, start of the rains (October 1 to December 1). Vertical dotted lines indicate precession-dominated insolation minima, correlated with Ca and ostracode abundance, indicating calcite saturation. Although these proxies exhibit a precession-forced threshold response, the exact phasing between lake level and insolation is likely obscured by the broad latitudinal extent of the Malawi drainage (Fig. 1); as the Intertropical Convergence Zone migrates, the timing of the rainy season varies along the length of the basin (SI Text). Additional peaks in Ca and Ostracode abundance at ≈75 and ≈97 kyr ago suggest half-precessional cycles, observed at very low latitudes (40). (e) Malawi lake levels vs. Eccentricity. (f) Dry woodland pollen dominated by Brachystegia, from marine core GeoB 1016, West Africa (36), showing high-amplitude precessional variability at 140–75 kyr ago, comparable to climate signals observed in Lake Malawi.

References

    1. Peterson LC, Haug GH, Hughen KA, Röhl U. Science. 2000;290:1947–1951. - PubMed
    1. Cane MA, Zebiak SE. Science. 1985;228:1085–1087. - PubMed
    1. Haug GH, Hughen KA, Sigman DM, Peterson LC, Röhl U. Science. 2001;293:1304–1308. - PubMed
    1. Lea DW, Pak DK, Peterson LC, Hughen KA. Science. 2003;301:1361–1364. - PubMed
    1. Johnson TC, Brown ET, McManus J, Barry S, Barker P, Gasse F. Science. 2002;296:113–132. - PubMed

Publication types