. 2007 Nov;27(21):7511-21.
doi: 10.1128/MCB.00753-07. Epub 2007 Sep 4.

Different electrostatic potentials define ETGE and DLG motifs as hinge and latch in oxidative stress response

Affiliations

Different electrostatic potentials define ETGE and DLG motifs as hinge and latch in oxidative stress response

Kit I Tong et al. Mol Cell Biol. 2007 Nov.

Abstract

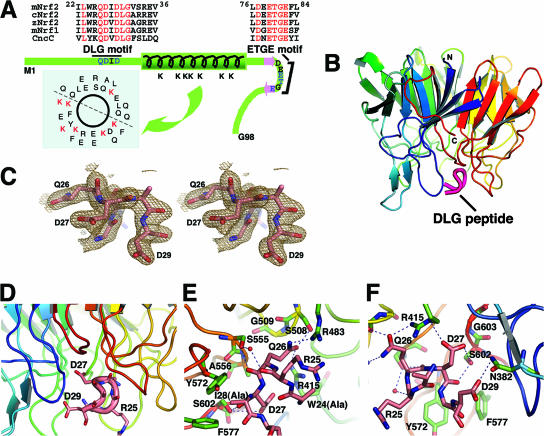
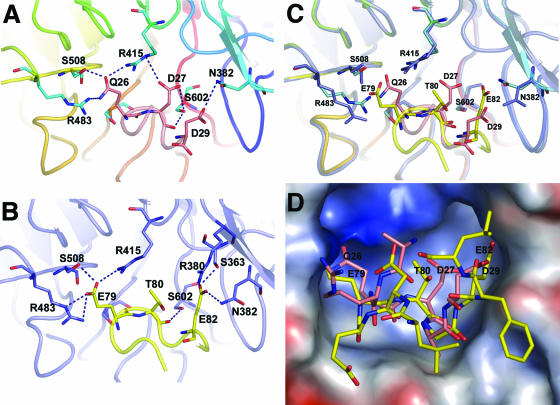
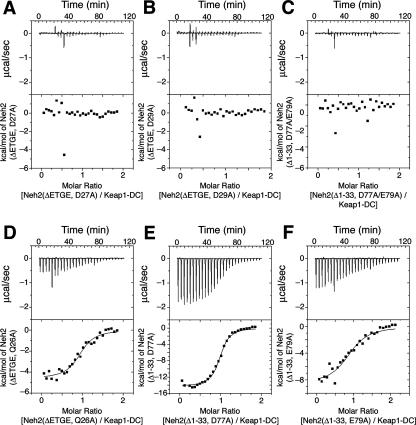
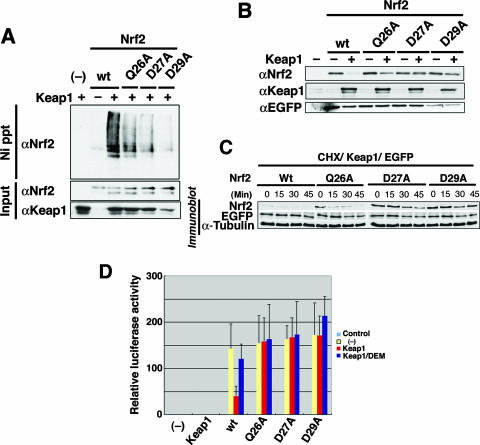
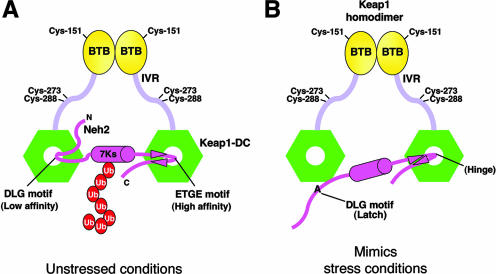
Nrf2 is the regulator of the oxidative/electrophilic stress response. Its turnover is maintained by Keap1-mediated proteasomal degradation via a two-site substrate recognition mechanism in which two Nrf2-Keap1 binding sites form a hinge and latch. The E3 ligase adaptor Keap1 recognizes Nrf2 through its conserved ETGE and DLG motifs. In this study, we examined how the ETGE and DLG motifs bind to Keap1 in a very similar fashion but with different binding affinities by comparing the crystal complex of a Keap1-DC domain-DLG peptide with that of a Keap1-DC domain-ETGE peptide. We found that these two motifs interact with the same basic surface of either Keap1-DC domain of the Keap1 homodimer. The DLG motif works to correctly position the lysines within the Nrf2 Neh2 domain for efficient ubiquitination. Together with the results from calorimetric and functional studies, we conclude that different electrostatic potentials primarily define the ETGE and DLG motifs as a hinge and latch that senses the oxidative/electrophilic stress.


Figures

FIG. 1.
FIG. 1.
Overall tertiary structure of mouse Keap1-DC (mKeap1-DC) complexed with the DLG peptide. (A) Schematic diagram of the Neh2 domain depicting the secondary structures and the two conserved DLG and ETGE motifs. The sequences of mouse Nrf2 (mNrf2), mouse Nrf1 (mNrf1), chicken Nrf2 (cNrf2), zebra fish Nrf2 (zNrf2), and Cap ‘n’ collar isoform C (CncC) are shown. The green bar represents a 33-amino-acid-long α-helix, and the two pink arrows denote β-strands. The ETGE motif is located in the loop region of the antiparallel β-sheet. The DLG motif is N terminal to the α-helix. Within these two motifs, residues that have a direct intermolecular interaction with Keap1 are shown in blue. The distribution of the seven lysines in the α-helical region of Neh2 is shown by the helical wheel. Regions corresponding to the DLG and ETGE motifs of the CNC protein family are aligned, and the residues in red are conserved. (B) The ribbon model of the tertiary structure of the mKeap1-DC β-propeller domain (blue to red) and the DLG peptide (magenta) was generated with PyMOL (http://pymol.sourceforge.net/). (C) Stereo view of a portion of the refined peptide in the protein-bound form showing Gln-26, Asp-27, and Asp-29. The final 2mFo − DFc difference Fourier map is contoured at 1 σ. (D) Close-up view of the peptide-binding region. The backbone and side chains of the bound peptide are shown as a pink tube and sticks, respectively. (E and F) Close-up view of the interface between mKeap1-DC and the DLG peptide, showing interfaces close to Gln26 (E) and Asp27 (F) of the DLG peptide. Residues potentially interacting between Keap1-DC (green) and the DLG peptide (pink) are in ball-and-stick representation. Nitrogen and oxygen atoms are shown in dark blue and red, respectively. The rest of the ribbon model for the backbone of Keap1-DC is colored as described above for panel A) Hydrogen bonds are represented by dashed lines. Potential structural water molecules are depicted as red circles.
FIG. 2.
FIG. 2.
Superimposition of the DLG peptide complex with the ETGE peptide complex. (A) Close-up view of the interface between mouse Keap1-DC (mKeap1-DC) and the DLG peptide. The backbone and side chains of the bound peptide are shown as a pink tube and sticks, respectively. The side chains of the interacting residues from Keap1-DC are shown as blue sticks. Dashed lines indicate intermolecular hydrogen bonding. Residues showing intermolecular interaction are labeled. (B) Close-up view of the interface between mKeap1-DC and the ETGE peptide. The backbone and side chains of the bound peptide are shown as a yellow tube and sticks, respectively. The side chains of the interacting residues from Keap1-DC are shown as blue sticks. Dashed lines indicate intermolecular hydrogen bonding. (C) Close-up view of the superimposed protein-peptide interfaces. Some of the residues of Keap1-DC (shown as sticks) potentially interacting with ETGE and DLG are shown in blue and cyan, respectively. The rest of the β-propeller domain is illustrated by a blue ribbon in the case of the ETGE peptide complex and blue to red as described in the legend to Fig. 1 in the case of the DLG peptide complex. Backbone and interacting residues of the ETGE peptide are displayed as yellow ribbons and sticks, respectively, whereas those of the DLG peptide are pink. Nitrogen and oxygen atoms are shown in dark blue and red, respectively. (D) Electrostatic surface potential of mKeap1-DC in the mKeap1-DC peptide complexes. Surface acidic, basic, and neutral residues are in red, blue, and white, respectively. The protein-bound ETGE (yellow) and DLG (pink) peptides are shown as sticks.
FIG. 3.
FIG. 3.
Different acidic residue concentrations account for the differential binding affinities of the ETGE and DLG motifs to Keap1. Representative ITC titration profiles of the titration of Keap1-DC with Neh2(ΔETGE,D27A) (A), Neh2(ΔETGE,D29A) (B), Neh2(Δ1-33,D77A/E79A) (C), Neh2(ΔETGE,Q26A) (D), Neh2(Δ1-33,D77A) (E), and Neh2(Δ1-33,E79A) (F). The top graphs represent the raw ITC thermograms, and the bottom graphs represent the fitted binding isotherms. The integrated binding isotherms are plotted against the molar ratio of different mutants of Neh2 to Keap1-DC.
FIG. 4.
FIG. 4.
The DLG motif facilitates the Keap1-mediated ubiquitination and protein turnover of Nrf2. (A) Keap1-mediated ubiquitination of wild-type (wt) Nrf2 (lanes 2 and 3) and Gln26Ala (Q26A), Asp27Ala (D27A), and Asp29Ala (D29A) mutants of Nrf2 were examined in the absence (−) or presence (+) of Keap1 by an in vivo ubiquitination assay in 293T cells. Lane 1 is a negative control without Nrf2 input (−). Modified Nrf2 was retrieved by nickel beads (Ni precipitation [Ni ppt]) and monitored by anti-Nrf2 antibody (αNrf2). The protein inputs for Nrf2 and Keap1 were detected by immunoblotting using anti-Nrf2 (αNrf2) and anti-Keap1 (αKeap1) antibodies, respectively. (B) The protein stabilities of wild-type Nrf2 (wt) or mutant Nrf2 (Q26A, D27A and D29A) in steady state were evaluated by immunoblotting in the absence (−) or presence (+) of Keap1 (αNrf2). Keap1 protein input in Cos7 cells and transfection efficiency controls using EGFP plasmid (anti-EGFP antibody [αEGFP]) are shown in the middle and bottom blots, respectively. (C) Protein stability of wild-type (Wt) and mutant Nrf2 after cycloheximide (35 μg/ml) treatment was monitored in 293T cells at 0, 15, 30, and 45 min. Transfection efficiency (EGFP) and protein input (α-Tubulin) controls are as shown. (D) The transactivation activities of wild-type and mutant Nrf2 (as indicated under the bar graph) in Cos7 cells were studied using a luciferase reporter assay in the absence (yellow bars) or presence (red and blue bars) of Keap1. Cells were treated with (blue bars) or without (red bars) the phase II enzyme inducer DEM. The leftmost bar (−) is a negative control with vehicle only.
FIG. 5.
FIG. 5.
Alanine mutation in the DLG motif mimics oxidative stress conditions. (A) Schematic diagram showing the two-site substrate recognition model. Keap1 is composed of BTB (yellow ovals), intervening region (IVR) (light violet bars), and DGR/CTR (Keap1-DC; green hexagons) domains. Some of the important reactive cysteines are labeled. Keap1 homodimer binds with one Neh2 domain (magenta hockey stick) of Nrf2. The middle magenta cylinder represents the α-helix, and the magenta arrowheads represent the β-strands of Neh2. All seven lysines (7Ks) of Neh2 are located within the α-helical region. The multiple ubiquitin (Ub) units are shown as red ovals. Neh2 binds to Keap1-DC via both the ETGE and DLG motifs under unstressed conditions. This complex configuration facilitates efficient ubiquitination of the lysines in the α-helix of Neh2. (B) Alanine mutations in the DLG motif reduce its affinity to Keap1 as well as debilitate Keap1-mediated ubiquitination of Nrf2, which mimics conditions of oxidative stress. The DLG motif, therefore, acts as a latch to lock and unlock the lysines of Neh2 in an appropriate spatial orientation for targeting ubiquitin transfer by the E2 enzyme in different cellular redox states.

Similar articles

Cited by

References

    1. Bonizzi, G., and M. Karin. 2004. The two NF-κB activation pathways and their role in innate and adaptive immunity. Trends Immunol. 25: 280-288. - PubMed
    1. Brunger, A. T., P. D. Adams, G. M. Clore, W. L. DeLano, P. Gros, R. W. Grosse-Kunstleve, J. S. Jiang, J. Kuszewski, M. Nilges, N. S. Pannu, R. J. Read, L. M. Rice, T. Simonson, and G. L. Warren. 1998. Crystallography & NMR system: a new software suite for macromolecular structure determination. Acta Crystallogr. Sect. D 54: 905-921. - PubMed
    1. Busino, L., M. Donzelli, M. Chiesa, D. Guardavaccaro, D. Ganoth, N. V. Dorrello, A. Hershko, M. Pagano, and G. F. Draetta. 2003. Degradation of Cdc25A by β-TrCP during S phase and in response to DNA damage. Nature 426: 87-91. - PubMed
    1. Ciechanover, A. 1994. The ubiquitin-proteasome proteolytic pathway. Cell 79: 13-21. - PubMed
    1. Ciechanover, A. 1998. The ubiquitin-proteasome pathway: on protein death and cell life. EMBO J. 17: 7151-7160. - PMC - PubMed

Publication types

MeSH terms

LinkOut - more resources