. 2007 Oct 1;204(10):2305-20.
doi: 10.1084/jem.20061893. Epub 2007 Sep 4.

Cdc42-interacting protein-4 functionally links actin and microtubule networks at the cytolytic NK cell immunological synapse

Affiliations

Cdc42-interacting protein-4 functionally links actin and microtubule networks at the cytolytic NK cell immunological synapse

Pinaki P Banerjee et al. J Exp Med. .

Abstract

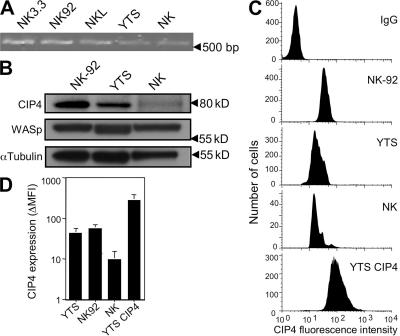
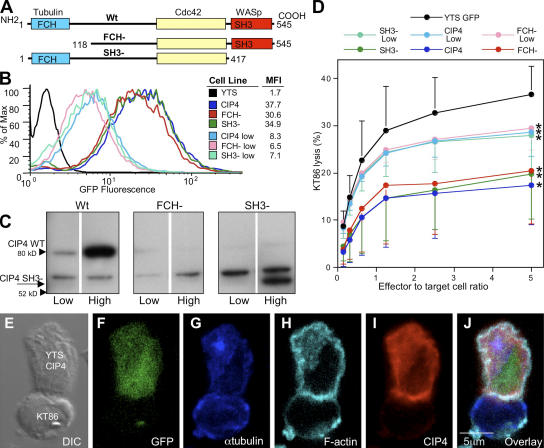
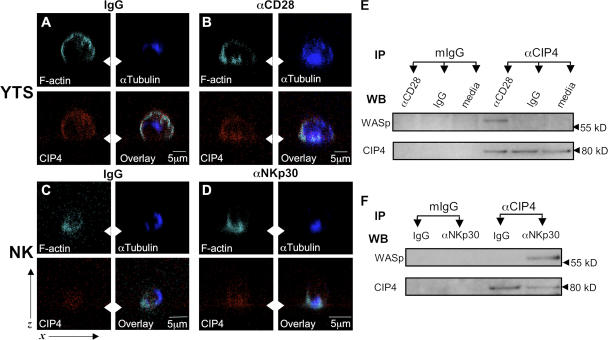
An essential function of the immunological synapse (IS) is directed secretion. NK cells are especially adept at this activity, as they direct lytic granules to the synapse for secretion, which enables cytotoxicity and facilitates host defense. This initially requires rearrangement of the actin cytoskeleton and, subsequently, microtubule-dependent trafficking of the lytic granules. As these two steps are sequential, specific linkages between them are likely to serve as critical regulators of cytotoxicity. We studied Cdc42-interacting protein-4 (CIP4), which constitutively interacts with tubulin and microtubules but focuses to the microtubule organizing center (MTOC) after NK cell activation, when it is able to associate with Wiskott-Aldrich syndrome protein (WASp) and the actin filament-rich IS. WASp deficiency, overexpression of CIP4, or parts of CIP4 interfere with this union and block normal CIP4 localization, MTOC polarization to the IS, and cytotoxicity. Reduction of endogenous CIP4 expression using small interfering RNA similarly inhibits MTOC polarization and cytotoxic activity but does not impair actin filament accumulation at the IS, or Cdc42 activation. Thus, CIP4 is an important cytoskeletal adaptor that functions after filamentous actin accumulation and Cdc42 activation to enable MTOC polarization and NK cell cytotoxicity.


Figures

Figure 1.
Figure 1.
CIP4 expression in NK cells. (A) RT-PCR for CIP4 message in NK cell lines and ex vivo NK cells. (B) Western blot (10 μg of protein per lane) for CIP4 in NK92, YTS, and ex vivo NK cells, as well as WASp and α-tubulin after stripping and reprobing membranes. (C) Intracellular CIP4 FACS using CIP4 mAb or IgG clone MOPC21 (in YTS cells as a specificity control, which was comparable with IgG control for the other cell types). Ex vivo NK cells were identified by FACS in total PBMCs by costaining for CD3 and CD56 and gating on CD3, CD56+ lymphocytes (NK). (D) The increase in CIP4 mean fluorescence intensity (MFI) over control IgG detected by FACS for YTS, NK92, ex vivo NK, and CIP4 YTS cells in three experiments and with six different donors of ex vivo cells is shown. IgG MFI was determined in parallel with each repeated assessment of CIP4. Error bars represent the SD.
Figure 2.
Figure 2.
Accumulation of CIP4 with the MTOC at the cytolytic but not noncytolytic IS. The cytolytic IS (A–F) between a YTS CD2-GFP cell and a KT86 cell, and a noncytolytic IS (G–L) between a YTS CD2-GFP cell and a K562 cell, as viewed by DIC microscopy (A and G), as well as confocal microscopy showing fluorescence for α-tubulin (B and H), pericentrin (C and I), CIP4 (D and J), CD2-GFP (E and K), and an overlay (F and L). Although an x-y plane was selected in the z axis to highlight the MTOC, disproportionate accumulation of CIP4 in other x-y planes was not found. (M) Accumulation of CD2, the tubulin-defined MTOC, or CIP4 in >200 conjugates over four experiments at the cytolytic (black bars) and noncytolytic (gray bars) IS. (N) Mean distance of the tubulin- (M to S) or pericentrin-defined (P to S) MTOC from the IS in YTS cells conjugated with KT86 (black bars) or K562 (gray bars) target cells is shown. Distances were greater in noncytolytic conjugates. (O) The area of α-tubulin, the MTOC, and CIP4 was measured in the x-y plane containing the MTOC in YTS cells conjugated with KT86 (black bars) or K562 (gray bars) target cells. The MTOC was defined as the region consisting of accumulated α-tubulin through the exclusion of nonaccumulated α-tubulin using a size and intensity threshold. (P) The percent colocalization calculated among areas is shown for the percentage of α-tubulin that colocalized with CIP4 (T/C), the MTOC that colocalized with CIP4 (M/C), CIP4 that colocalized with the MTOC (C/M), and CIP4 that colocalized with α-tubulin (C/T). Significant differences between the cytolytic (black bars) and noncytolytic (gray bars) synapses are noted. (Q) In YTS cells engaged in cytolytic (black bars) and noncytolytic (gray bars) conjugates, the mean percentage of the pericentrin-defined MTOC that colocalized with the α-tubulin–defined MTOC (P/M), the percentage of the α-tubulin–defined MTOC that colocalized with the pericentrin-defined MTOC (M/P), and the percentage of the pericentrin-defined MTOC that colocalized with CIP4 (P/C) are shown. Error bars represent the SD. *, P < 0.01.
Figure 3.
Figure 3.
Colocalization of CIP4 with the MTOC and accumulated F-actin at the cytolytic IS. Cytolytic conjugates between a YTS GFP cell and a KT86 cell (A–F), and an NK92 cell and a K562 GFP cell (G–L). DIC images (A and G) and GFP expression in the YTS cell (B), or in the K562 cell (H), distinguish the NK cell from the target cell. Confocal microscopy for F-actin (C and I), α-tubulin (D and J), CIP4 (E and K), and an overlay (F and L) are shown. (M) Molecular accumulations in NK cells from ≥150 conjugates over at least three experiments between NK92 and K562 cells, YTS GFP and KT86 cells, YTS CIP4 and KT86 cells, CIP4 FCH and KT86 cells, and CIP4 SH3 and KT86 cells. CIP4 accumulation was not determined for the CIP4-overexpressing cells, as it was diffuse. (N) The total area of F-actin, the tubulin-defined MTOC, and CIP4 measured in ≥15 conjugated NK cells over three experiments between NK92 and K562 cells (black bars), YTS GFP and KT86 cells (light gray bars), and YTS CIP4 and KT86 cells (dark gray bars). CIP4 mutants were not detected with anti-CIP4 mAb. (O) The percent colocalization among the areas in ≥15 conjugated NK cells over three experiments between NK92 and K562 cells (black bars), YTS GFP and KT86 cells (light gray bars), and YTS CIP4 and KT86 cells (dark gray bars) was calculated to demonstrate the percentages of the MTOC colocalized with CIP4 (M/C), of the CIP4 colocalized with the MTOC (C/M), of the F-actin colocalized with CIP4 (A/C), and of the CIP4 colocalized F-actin (C/A). Differences between YTS GFP and NK92 cells were not significant, but those between YTS CIP4 and YTS GFP cells were. Error bars represent the SD. *, P < 0.01.
Figure 4.
Figure 4.
Stable overexpression of CIP4 or CIP4 mutants in NK cells. (A) Schematic of constructs for CIP4 WT (top), CIP4 FCH (middle), or SH3 (bottom) used to generate bicistronic retroviral expression vectors (blue, FCH domain; red, SH3 domain. (B) Transduced YTSeco cells were sorted via FACS into populations with comparable GFP expression (numbers show GFP MFI), and cultures had consistent GFP expression over time. (C) Western blot of CIP4 WT (left), CIP4 FCH (middle), and CIP4 SH3 (right) low and high overexpressing cell lines using anti-CIP4 pAb. The middle band is nonspecific, and the antibody failed to recognize the FCH domain–deleted CIP4. (D) Cytotoxicity of CIP4-overexpressing YTS cells against KT86 target cells. Each point represents the mean of four experiments, and decreased activity was significant (P < 0.01) for all effector/target ratios in high, but only at 5:1 and 2.5:1 in low, overexpressing cells. (E and F) A representative conjugate between YTS CIP4 high overexpressing cells (top) and a KT86 target cell (bottom) was evaluated using DIC (E) and by confocal microscopy for GFP expression (F), α-tubulin (G), F-actin (H), CIP4 (I), and an overlay (J).
Figure 5.
Figure 5.
Associations of endogenous and overexpressed CIP4. (A) CIP4 was precipitated from lysates of 2 ×10⁶ YTS CIP4 cells, 2 ×10⁶ parental YTS cells, or 2 × 10⁷ ex vivo NK cells using mAb anti-CIP4. Immunoprecipitation with nonspecific mouse isotype-matched mAb IgG (mIgG) is shown as a control. CIP4 was identified in immunoprecipitates by Western blotting using anti-CIP4 mAb (top). Blots were stripped and reprobed for α-tubulin (middle) and WASp (bottom; blots represent three to six independent results). (B) YTS cell lysates cleared of nuclei and debris were incubated with or without stabilized microtubules, after which microtubules and associated proteins were precipitated. CIP4 and α-tubulin were identified by Western blotting in the supernatant (Supt) and precipitate (PPT).
Figure 6.
Figure 6.
Localization of CIP4 in normal and WASp-deficient ex vivo NK cells. An NK cell (top) and target cell (bottom) in conjugates between a normal donor ex vivo NK cell and a K562 target cell (A–E), as well as a WAS-patient ex vivo NK cell and a K562 target cell (F–J), using DIC microscopy (A and F). F-actin (B and G), α-tubulin (C and H), CIP4 (D and I), and an overlay (E and J) were detected using confocal microscopy. (K) Molecular accumulation at the IS in >150 NK cells conjugated with K562 target cells in at least three experiments are shown using normal donor (black bars) or WAS-patient (gray bars) NK cells. (L) The area of F-actin, the α-tubulin–defined MTOC, and CIP4 was measured in ≥15 conjugated NK cells over three experiments between K562 target cells and normal donor (black bars) or WAS-patient NK cells (gray bars). (M) The percentage of the MTOC that colocalized with CIP4 (M/C), CIP4 that colocalized with the MTOC (C/M), F-actin that colocalized with CIP4 (A/C), and CIP4 that colocalized with F-actin (C/A) was calculated for the measured areas in the conjugated normal donor and WAS-patient NK cells. Decreases in WAS-patient NK cells were significant. *, P < 0.01.
Figure 7.
Figure 7.
Alteration in association of endogenous CIP4 after NK cell activation. YTS cells were incubated on slides coated with IgG (A) or anti-CD28 (B) and ex vivo NK cells on slides coated with IgG (C) or anti-NKp30 (D) for 30 min and evaluated via confocal microscopy in the x-z plane. The arrowheads show the plane of the slide. Fluorescence demonstrating F-actin (cyan), α-tubulin (blue), and CIP4 (red) is shown. (E) 106 YTS cells were incubated in wells containing IgG, anti-CD28 mAb, or media for 30 min and then lysed. CIP4 was immunoprecipitated using mAb anti-CIP4 and probed for WASp and CIP4 by Western blotting. Immunoprecipitation with nonspecific mIgG was performed as a control. (F) 107 ex vivo NK cells were lysed after a 30-min incubation in wells coated with IgG or anti-NKp30 mAb, and CIP4 was immunoprecipitated using mAb anti-CIP4. WASp and CIP4 were detected in immunoprecipitates by Western blotting. Immunoprecipitation with nonspecific mIgG was performed in parallel as a control. Blots represent at least three independent results.
Figure 8.
Figure 8.
Requirement for CIP4 in NK cell cytotoxicity and MTOC polarization but not F-actin accumulation. (A) siRNA specific for CIP4 or GAPDH were introduced into YTS cells by nucleofection, and after 60 h were lysed and evaluated for the presence of CIP4 or GAPDH via Western blotting. Myosin-II was used as a loading control. (B) KT86 target-cell killing by YTS cells, 60 h after nucleofection of the YTS cells with either CIP4 or GAPDH siRNA. The x axis represents the effector/target cell ratio. (C) F-actin accumulation at and MTOC polarization to the IS assessed by confocal microscopy in ≥50 conjugates between YTS cells and KT86 cells 60 h after nucleofection of the YTS cells with either CIP4 (black bars) or GAPDH (gray bars) siRNA. All results represent at least three independent experiments.
Figure 9.
Figure 9.
CIP4 function in MTOC polarization relative to Cdc42 activation. The cytolytic IS between a KT86 cell and a YTS cell nucleofected with constitutively active Cdc42V12-GFP and GAPDH siRNA (A–F) or CIP4 siRNA (G–L) are shown using DIC microscopy (A and G), as well as confocal microscopy showing fluorescence for α-tubulin (B and H), pericentrin (C and I), CIP4 (D and J), Cdc42V12-GFP (E and K), and an overlay (F and L). (M) The mean percentage of the pericentrin-defined MTOC that colocalized with the tubulin-defined MTOC (P/M) and the percentage of the α-tubulin–defined MTOC that colocalized with the pericentrin-defined MTOC (M/P) in YTS cells nucleofected with Cdc42V12-GFP and GAPDH siRNA (black bars) or Cdc42V12-GFP and CIP4 siRNA (gray bars), and conjugated with KT86 target cells, are shown. (N) Mean distance in micrometers of the pericentrin-defined MTOC to the IS in YTS cells nucleofected with Cdc42V12-GFP and GAPDH siRNA, or Cdc42V12-GFP and CIP4 siRNA. The increase in cells receiving CIP4 siRNA was significant. *, P < 0.01. (O) Active Cdc42 pull down and Cdc42 Western blot from YTS cells activated with immobilized anti-CD28. Before activation, cells were nucleofected with GFP or Cdc42V12-GFP (top), or nucleofected with GAPDH siRNA or CIP4 siRNA (middle). Activated YTS cells were also compared with activated YTS cells overexpressing WT CIP4 (bottom). Error bars represent the SD.

References

    1. Davis, D.M., and M.L. Dustin. 2004. What is the importance of the immunological synapse? Trends Immunol. 25:323–327. - PubMed
    1. Poo, W.J., L. Conrad, and C.A. Janeway Jr. 1988. Receptor-directed focusing of lymphokine release by helper T cells. Nature. 332:378–380. - PubMed
    1. Kupfer, A., T.R. Mosmann, and H. Kupfer. 1991. Polarized expression of cytokines in cell conjugates of helper T cells and splenic B cells. Proc. Natl. Acad. Sci. USA. 88:775–779. - PMC - PubMed
    1. Kupfer, A., G. Dennert, and S.J. Singer. 1983. Polarization of the Golgi apparatus and the microtubule-organizing center within cloned natural killer cells bound to their targets. Proc. Natl. Acad. Sci. USA. 80:7224–7228. - PMC - PubMed
    1. Peters, P.J., J. Borst, V. Oorschot, M. Fukuda, O. Krahenbuhl, J. Tschopp, J.W. Slot, and H.J. Geuze. 1991. Cytotoxic T lymphocyte granules are secretory lysosomes, containing both perforin and granzymes. J. Exp. Med. 173:1099–1109. - PMC - PubMed

Publication types

MeSH terms

Substances