. 2007 Sep 1;21(17):2205-19.
doi: 10.1101/gad.436007.

Tension-sensitive Plk1 phosphorylation on BubR1 regulates the stability of kinetochore microtubule interactions

Affiliations

Tension-sensitive Plk1 phosphorylation on BubR1 regulates the stability of kinetochore microtubule interactions

Sabine Elowe et al. Genes Dev. .

Abstract

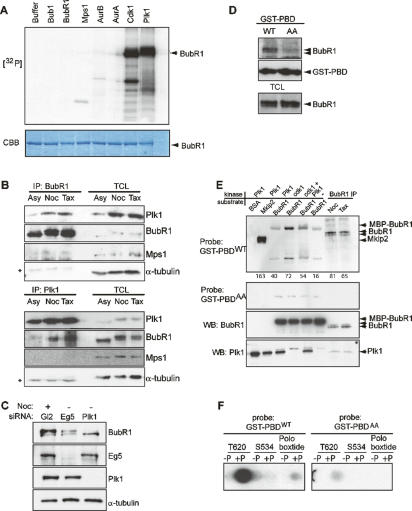
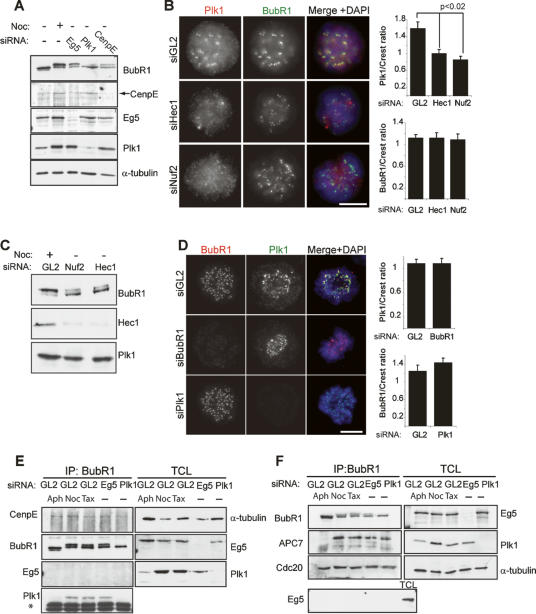
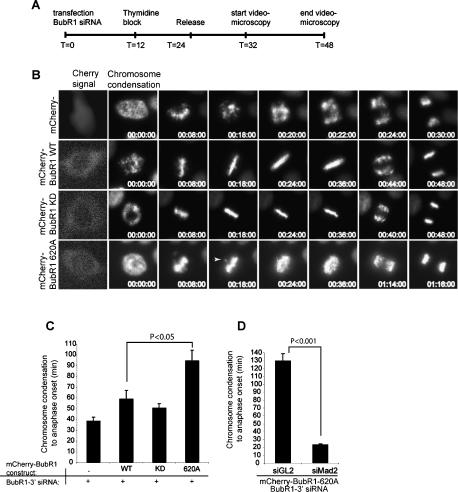
Mitotic phosphorylation of the spindle checkpoint component BubR1 is highly conserved throughout evolution. Here, we demonstrate that BubR1 is phosphorylated on the Cdk1 site T620, which triggers the recruitment of Plk1 and phosphorylation of BubR1 by Plk1 both in vitro and in vivo. Phosphorylation does not appear to be required for spindle checkpoint function but instead is important for the stability of kinetochore-microtubule (KT-MT) interactions, timely mitotic progression, and chromosome alignment onto the metaphase plate. By quantitative mass spectrometry, we identify S676 as a Plk1-specific phosphorylation site on BubR1. Furthermore, using a phospho-specific antibody, we show that this site is phosphorylated during prometaphase, but dephosphorylated at metaphase upon establishment of tension between sister chromatids. These findings describe the first in vivo verified phosphorylation site for human BubR1, identify Plk1 as the kinase responsible for causing the characteristic mitotic BubR1 upshift, and attribute a KT-specific function to the hyperphosphorylated form of BubR1 in the stabilization of KT-MT interactions.


Figures

Figure 1.
Figure 1.
Hyperphosphorylation of BubR1 is regulated in vitro and in vivo by Cdk1 and Plk1. (A) In vitro kinase assays with indicated kinases or buffer alone. Protein phosphorylation is visualized by autoradiography ([32P], top panel) and equal protein loading by Coomassie Blue staining (CBB, bottom panel). (B) Immunoprecipitation of endogenous BubR1 (top panels) or endogenous Plk1 (bottom panels) from asynchronously growing (Asy) and nocodazole-arrested (Noc) or Taxol-arrested (Tax) HeLa cells. Immunoprecipitates and corresponding total cell lysates (TCL) were probed by Western blotting for the indicated proteins. Asterisk (*) marks the IgG heavy chain. Note the lower abundance of Plk1 in asynchronous lysates. (C, top panel) Electrophoretic mobility of endogenous BubR1 from nocodazole-arrested and Eg5- or Plk1-depleted HeLa cells, as determined by Western blotting. Efficient depletion of Eg5 and Plk1 and equal loading (α-tubulin) are shown in the panels below. (D) Pull-downs from mitotic HeLa lysate using immobilized GST-PBDWT and GST-PBDAA were probed for BubR1 (top panel) and GST (middle panel). Equal input is demonstrated by BubR1 Western blotting onto TCLs (bottom panel). (E) Kinase assay and Far Western. Substrates and kinases were incubated together in an in vitro kinase assay as described in Materials and Methods. Samples were resolved by SDS-PAGE, transferred onto nitrocellulose membrane, probed with GST-PBDWT (top panel), and then reprobed with GST-PBDAA (second panel). Notably, sequential phosphorylation by Cdk1 and Plk1 caused a more diffused pattern of PBD binding, suggesting a retarded mobility of BubR1, likely caused by phosphorylation. Equal levels of BubR1 (third panel) and Plk1 (bottom panel) are indicated by Western blotting. The numbers below the top panel indicate band intensities, as quantified using ImageJ software. (F) Spot arrays of peptides representing the PBD-binding motif surrounding Thr 620 of BubR1 (T620), an unrelated serine/threonine-rich sequence of BubR1 (S534), and the poloboxtide, each synthesized in the nonphosphorylated (−P) and phosphorylated (+P) form. Membranes were probed with GST-PBDWT (left panel) or GST-PBDAA (right panel). Peptide sequences are described in the Supplemental Material.
Figure 2.
Figure 2.
BubR1 hyperphosphorylation occurs primarily at the KT but does not affect BubR1 KT recruitment and SAC function. (A) Interphase lysates or mitotic lysates from nocodazole-treated and either Eg5-, Plk1-, or CenpE-depleted cells (isolated by mitotic shake-off) were resolved by gel electrophoresis. Then, the levels and migration of BubR1 (top panel), CenpE, Eg5, Plk1, and α-tubulin were determined by Western blotting. (B) BubR1 and Plk1 localization in HeLa cells depleted of Hec1 and Nuf2. Bar, 10 μm. Panels on the right show quantifications of Plk1 (top) and BubR1 (bottom) staining intensities at KTs (normalized for CREST staining) in the various samples (mean ± standard error, SE; n ≥ 100 KTs from five different cells). (C) Lysates were prepared from nocodazole-arrested cells or prometaphase cells depleted of Nuf2 or Hec1. They were then probed by Western blotting with the antibodies indicated. (D) Interdependence of Plk1 and BubR1 localization during mitosis was assessed by indirect immunofluorescence. Bar, 10 μm. Panels on the right show quantifications of Plk1 and BubR1 staining intensities at KTs (normalized for CREST staining) in reciprocal siRNA depletions (mean ± SE; n ≥ 100 KTs from five different cells). (E) Interphase lysates or lysates from nocodazole- or Taxol-treated as well as Eg5- and Plk1-depleted cells were prepared. (Left panels) BubR1 immunoprecipitates were then resolved by SDS-PAGE, and coimmunoprecipitation of CenpE and Plk1, as well as Eg5 (for control), was examined by Western blotting. Asterisk (*) indicates IgG heavy chain. (Right panels) In parallel, corresponding TCLs were probed by Western blotting with the antibodies indicated. (F) Cell lysates were prepared as in E, and BubR1 immunoprecipitates were assessed for coimmunoprecipitation of APC7 and Cdc20; Eg5 was examined for control.
Figure 3.
Figure 3.
The cold stability of KT–MT connections is reduced in cells expressing BubR1T620A. (A) Schematic representation of BubR1 siRNA, rescue transfection, and cold treatment protocol. HeLa S3 cells were simultaneously transfected with the indicated Flag-BubR1 constructs and BubR1-3′ duplexes. After 36 h, cells were treated with Monastrol for 5 h, followed by a 1-h release in the presence of the proteosome inhibitor MG132, resulting in a metaphase-arrested population. Cells were then incubated for the indicated times at 4°C before they were fixed and processed for immunofluorescence microscopy. (B) Cells treated according to the protocol outlined in A were costained for α-tubulin (green), KTs (CREST) (red), and Flag (not shown). Bar, 10 μm. Representative KT–MT connections were enlarged and are shown on the right. (C) Quantification of MT density in B. Average MT intensity (mean ± SE; n ≥ 10 transfected cells) was measured in each condition. Intensities are expressed relative to total cellular areas and normalized against T0 for each condition (MT density at T0 = 100%).
Figure 4.
Figure 4.
Time-lapse videomicroscopy of cells expressing BubR1 WT, KD, or T620A. (A) Schematic representation of BubR1 siRNA, rescue transfection, and videomicroscopy protocol. Cells were simultaneously transfected with the indicated mCherry-BubR1 constructs and BubR1-3′ duplexes, and arrested by addition of thymidine 12 h later. After a further 12 h, they were released from the block, and imaging was started 8 h later for a total duration of 16 h. (B) Representative stills illustrating mitotic progression in cells depleted of BubR1 and rescued with mCherry-BubR1 constructs. Images were acquired at the indicated time points after the start of chromosome condensation. (C) Histogram indicating the time elapsed between the beginning of chromosome condensation and anaphase onset in cells treated as in A. Results present the average of five independent experiments (±SE; n ≥ 8 cells per experiment). (D) As in C, except that cells expressing mCherry-BubR1T620A were transfected with 3′-UTR siRNA duplexes against BubR1 and either GL2 or Mad2. Results present the average of four independent experiments (±SE; n ≥ 34 cells each condition).
Figure 5.
Figure 5.
Identification of Ser 676 as an in vivo phosphorylation site on BubR1. (A) Collision-induced dissociation (CID) mass spectrum of the BubR1-derived phosphopeptide LSPIIED(pS)R. C-terminal and N-terminal fragments of the peptide are marked as y-ions and b-ions, respectively. Fragments containing the phosphate are marked in red, and fragments showing a characteristic loss of phosphoric acid are labeled “-ph.acid.” The observed peptide fragments are also shown within the peptide sequence above the spectrum, demonstrating that the indicated serine residue within this peptide is indeed phosphorylated. This spectrum was acquired on a quadrupole time-of-flight mass spectrometer (Q-TOF Ultima). (B) The relative intensity of the phosphopeptide shown in A was measured in a mitotic versus an S-phase-arrested extract, using stable isotope labeling in cell culture (see Materials and Methods). The observed ratio was corrected to compensate for the higher expression level of BubR1 in mitosis compared with S phase, as determined using unphosphorylated BubR1-derived peptides from the same sample. (C) Sequence alignment of S676 (red box) and surrounding residues indicating conservation of this site in several BubR1-expressing species. Asterisk (*) indicates sequence predicted by bioinformatics data mining.
Figure 6.
Figure 6.
BubR1 Ser 676 is a Plk1-dependent phosphorylation site. (A) Anti-pS676 was used in Western blotting on lysates from aphidicolin-arrested (Aph) and nocodazole-arrested (Noc) cells. The same blot was stripped and reprobed with anti-BubR1 antibodies (top right panel) and tubulin (bottom right panel). (B, top panel) Western blotting with anti-pS676 onto aphidicolin-arrested (Aph) and nocodazole-arrested (Noc) cells, and onto cells depleted of Eg5 and Plk1 by siRNA. The membrane was reprobed with anti-BubR1 antibodies (middle panel), and equal loading is demonstrated by Western blotting for α-tubulin (bottom panel). (C) Immunofluorescent staining of cells treated with the indicated siRNA duplexes. Cells were costained with anti-pS676 (red), anti-BubR1 (green), and DAPI (blue). Bar, 10 μm. (D) Mitotic cells within an asynchronously growing HeLa cell population were costained for pS676 (red) and BubR1 (green). DNA was stained with DAPI (blue). Bar, 10 μm. (E,F) Quantification of the results in C and D, respectively. Data represent the mean percentage of cells staining positive for pS676 immunofluorescence on most if not all KTs (mean ± SE; n ≥ 100 cells for each of three independent experiments).
Figure 7.
Figure 7.
Ser 676 is phosphorylated on misaligned KTs and in response to lack of tension. (A) Control-depleted (siGL2) or CenpE-depleted (siCenpE) cells were stained with anti-pS676 (red) and anti-BubR1 (green) antibodies. DNA is visualized with DAPI (blue). (B) Cells were blocked in prometaphase using Monastrol (16 h) and subsequently released for 1 h into MG132 to allow for metaphase plate formation. Parallel samples were then treated for 1 h with 10 μM Taxol to induce loss of tension or DMSO for solvent control. Cells were fixed and costained for pS676 (red) and BubR1 (green). DNA was visualized using DAPI (blue). Bar, 10 μm. (C) Quantification of B. Intensity ratios of pS676 normalized for total BubR1 (mean ± SE; n ≥ 100 KTs from five individual cells). (D) Lysates were prepared from asynchronously growing cells (Asy), nocodazole-arrested cells (Noc), or Taxol-arrested cells (Tax), and cells arrested at metaphase by MG132 treatment after release from prometaphase block (MG). (Top panel) They were resolved by SDS-PAGE and probed by Western blotting for pS676. The same membrane was subsequently reprobed for total BubR1, cyclin B1, and α-tubulin. (E) Cells were treated as in B and then costained for RanGAP1 (red), pS676 (green), and CREST (blue). Selected KT–MT attachments were enlarged and are shown below each image. Bar, 10 μm. (F) KTs from E were examined for the presence of RanGAP1 and pS676 signals after DMSO or Taxol treatment. The histogram shows mean KT numbers (±SE; n > 500 KTs from eight individual cells). (G) Working model describing the proposed role of BubR1 phosphorylation (see Discussion).

References

    1. Abrieu A., Kahana J.A., Wood K.W., Cleveland D.W., Kahana J.A., Wood K.W., Cleveland D.W., Wood K.W., Cleveland D.W., Cleveland D.W. CENP-E as an essential component of the mitotic checkpoint in vitro. Cell. 2000;102:817–826. - PubMed
    1. Ahonen L.J., Kallio M.J., Daum J.R., Bolton M., Manke I.A., Yaffe M.B., Stukenberg P.T., Gorbsky G.J., Kallio M.J., Daum J.R., Bolton M., Manke I.A., Yaffe M.B., Stukenberg P.T., Gorbsky G.J., Daum J.R., Bolton M., Manke I.A., Yaffe M.B., Stukenberg P.T., Gorbsky G.J., Bolton M., Manke I.A., Yaffe M.B., Stukenberg P.T., Gorbsky G.J., Manke I.A., Yaffe M.B., Stukenberg P.T., Gorbsky G.J., Yaffe M.B., Stukenberg P.T., Gorbsky G.J., Stukenberg P.T., Gorbsky G.J., Gorbsky G.J. Polo-like kinase 1 creates the tension-sensing 3F3/2 phosphoepitope and modulates the association of spindle-checkpoint proteins at kinetochores. Curr. Biol. 2005;15:1078–1089. - PubMed
    1. Barr F.A., Sillje H.H., Nigg E.A., Sillje H.H., Nigg E.A., Nigg E.A. Polo-like kinases and the orchestration of cell division. Nat. Rev. Mol. Cell Biol. 2004;5:429–440. - PubMed
    1. Baumann C., Korner R., Hofmann K., Nigg E.A., Korner R., Hofmann K., Nigg E.A., Hofmann K., Nigg E.A., Nigg E.A. PICH, a centromere-associated SNF2 family ATPase, is regulated by Plk1 and required for the spindle checkpoint. Cell. 2007;128:101–114. - PubMed
    1. Bharadwaj R., Yu H., Yu H. The spindle checkpoint, aneuploidy, and cancer. Oncogene. 2004;23:2016–2027. - PubMed

Publication types

LinkOut - more resources