

Prediction of individual genetic risk to disease from genome-wide association studies
- PMID: 17785532
- PMCID: PMC1987352
- DOI: 10.1101/gr.6665407
Prediction of individual genetic risk to disease from genome-wide association studies
Abstract
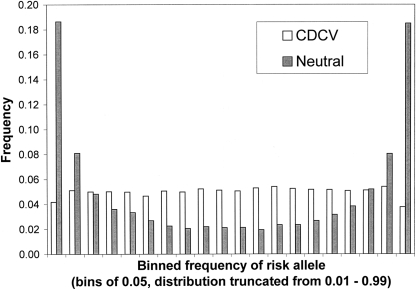
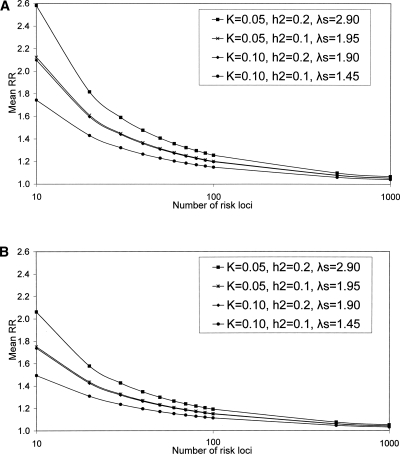
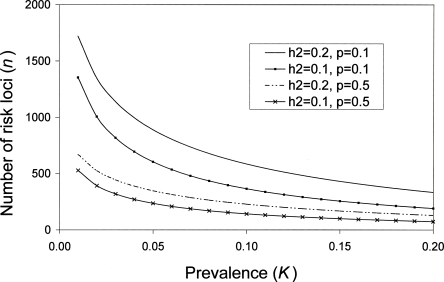
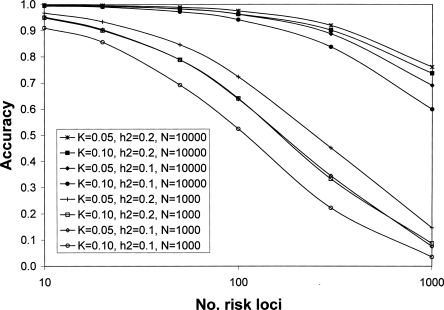
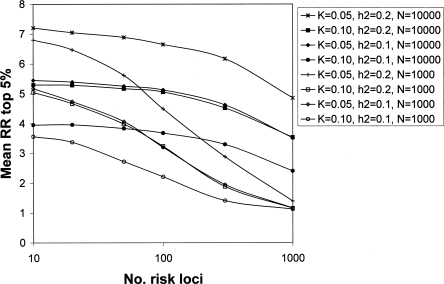
Empirical studies suggest that the effect sizes of individual causal risk alleles underlying complex genetic diseases are small, with most genotype relative risks in the range of 1.1-2.0. Although the increased risk of disease for a carrier is small for any single locus, knowledge of multiple-risk alleles throughout the genome could allow the identification of individuals that are at high risk. In this study, we investigate the number and effect size of risk loci that underlie complex disease constrained by the disease parameters of prevalence and heritability. Then we quantify the value of prediction of genetic risk to disease using a range of realistic combinations of the number, size, and distribution of risk effects that underlie complex diseases. We propose an approach to assess the genetic risk of a disease in healthy individuals, based on dense genome-wide SNP panels. We test this approach using simulation. When the number of loci contributing to the disease is >50, a large case-control study is needed to identify a set of risk loci for use in predicting the disease risk of healthy people not included in the case-control study. For diseases controlled by 1000 loci of mean relative risk of only 1.04, a case-control study with 10,000 cases and controls can lead to selection of approximately 75 loci that explain >50% of the genetic variance. The 5% of people with the highest predicted risk are three to seven times more likely to suffer the disease than the population average, depending on heritability and disease prevalence. Whether an individual with known genetic risk develops the disease depends on known and unknown environmental factors.
Figures
References
-
- Barrett J.C., Cardon L.R., Cardon L.R. Evaluating coverage of genome-wide association studies. Nat. Genet. 2006;38:659–662. - PubMed
-
- Barton N.H., Keightley P.D., Keightley P.D. Understanding quantitative genetic variation. Nat. Rev. Genet. 2002;3:11–21. - PubMed
-
- Bell J. Predicting disease using genomics. Nature. 2004;429:453–456. - PubMed
-
- Bertram L., McQueen M.B., Mullin K., Blacker D., Tanzi R.E., McQueen M.B., Mullin K., Blacker D., Tanzi R.E., Mullin K., Blacker D., Tanzi R.E., Blacker D., Tanzi R.E., Tanzi R.E. Systematic meta-analyses of Alzheimer disease genetic association studies: The AlzGene database. Nat. Genet. 2007;39:17–23. - PubMed
-
- Carlson C.S., Eberle M.A., Kruglyak L., Nickerson D.A., Eberle M.A., Kruglyak L., Nickerson D.A., Kruglyak L., Nickerson D.A., Nickerson D.A. Mapping complex disease loci in whole-genome association studies. Nature. 2004;429:446–452. - PubMed
Publication types
MeSH terms
LinkOut - more resources
Full Text Sources
Other Literature Sources