

High-throughput methylation profiling by MCA coupled to CpG island microarray
- PMID: 17785535
- PMCID: PMC1987348
- DOI: 10.1101/gr.6417007
High-throughput methylation profiling by MCA coupled to CpG island microarray
Abstract
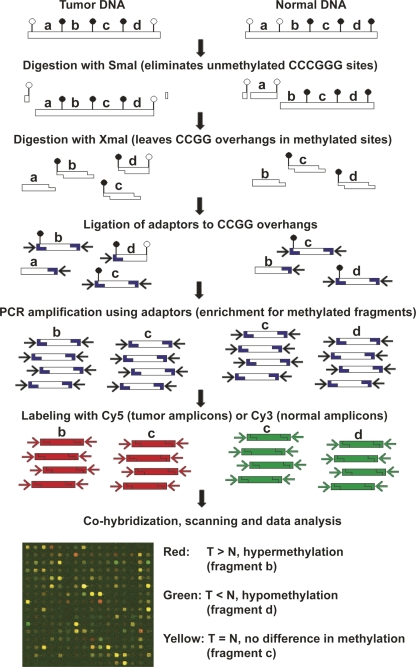
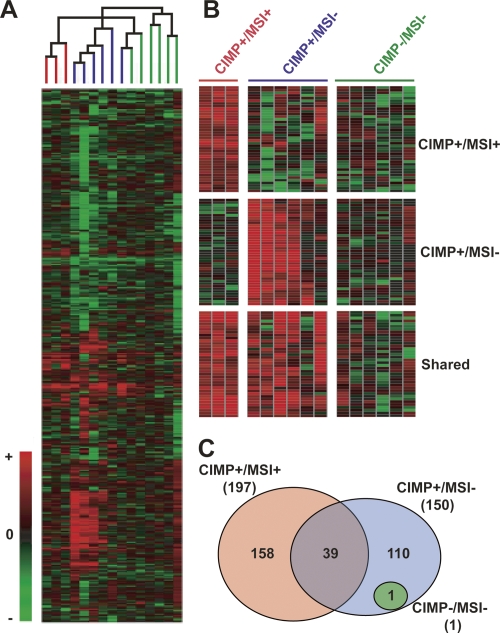
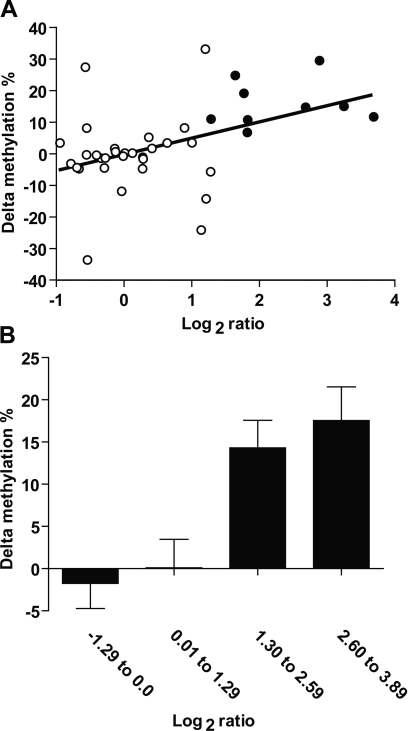
An abnormal pattern of DNA methylation occurs at specific genes in almost all neoplasms. The lack of high-throughput methods with high specificity and sensitivity to detect changes in DNA methylation has limited its application for clinical profiling. Here we overcome this limitation and present an improved method to identify methylated genes genome-wide by hybridizing a CpG island microarray with amplicons obtained by the methylated CpG island amplification technique (MCAM). We validated this method in three cancer cell lines and 15 primary colorectal tumors, resulting in the discovery of hundreds of new methylated genes in cancer. The sensitivity and specificity of the method to detect hypermethylated loci were 88% and 96%, respectively, according to validation by bisulfite-PCR. Unsupervised hierarchical clustering segregated the tumors into the expected subgroups based on CpG island methylator phenotype classification. In summary, MCAM is a suitable technique to discover methylated genes and to profile methylation changes in clinical samples in a high-throughput fashion.
Figures
Similar articles
-
Deoxyribonucleic acid methylation profiling of single human blastocysts by methylated CpG-island amplification coupled with CpG-island microarray.Fertil Steril. 2015 Jun;103(6):1566-71.e1-4. doi: 10.1016/j.fertnstert.2015.03.020. Epub 2015 Apr 22. Fertil Steril. 2015. PMID: 25914096 Free PMC article.
-
Use of CpG island microarrays to identify colorectal tumors with a high degree of concurrent methylation.Methods. 2002 Jun;27(2):162-9. doi: 10.1016/s1046-2023(02)00070-1. Methods. 2002. PMID: 12095276
-
Analysis of CpG island methylation using rolling Circle amplification (RCA) product microarray.J Biomed Nanotechnol. 2011 Apr;7(2):292-9. doi: 10.1166/jbn.2011.1287. J Biomed Nanotechnol. 2011. PMID: 21702367
-
DNA methylation profiling using the methylated-CpG island recovery assay (MIRA).Methods. 2010 Nov;52(3):213-7. doi: 10.1016/j.ymeth.2010.03.004. Epub 2010 Mar 19. Methods. 2010. PMID: 20304072 Free PMC article. Review.
-
Methods for detecting DNA methylation in tumors: from bench to bedside.Cancer Lett. 2007 Jun 28;251(2):187-98. doi: 10.1016/j.canlet.2006.10.014. Epub 2006 Dec 12. Cancer Lett. 2007. PMID: 17166656 Review.
Cited by
-
Genome-wide DNA methylation profiling of chronic lymphocytic leukemia allows identification of epigenetically repressed molecular pathways with clinical impact.Epigenetics. 2010 Aug 16;5(6):499-508. doi: 10.4161/epi.5.6.12179. Epub 2010 Aug 16. Epigenetics. 2010. PMID: 20484983 Free PMC article.
-
Principles and challenges of genomewide DNA methylation analysis.Nat Rev Genet. 2010 Mar;11(3):191-203. doi: 10.1038/nrg2732. Nat Rev Genet. 2010. PMID: 20125086 Review.
-
Alterations of DNA methylome in human bladder cancer.Epigenetics. 2013 Oct;8(10):1013-22. doi: 10.4161/epi.25927. Epub 2013 Aug 6. Epigenetics. 2013. PMID: 23975266 Free PMC article. Review.
-
Large-scale analysis of DNA methylation in chronic lymphocytic leukemia.Epigenomics. 2009 Oct;1(1):39-61. doi: 10.2217/epi.09.10. Epigenomics. 2009. PMID: 20495622 Free PMC article.
-
Profiling DNA methylomes from microarray to genome-scale sequencing.Technol Cancer Res Treat. 2010 Apr;9(2):139-47. doi: 10.1177/153303461000900203. Technol Cancer Res Treat. 2010. PMID: 20218736 Free PMC article. Review.
References
-
- Costello J.F., Fruhwald M.C., Smiraglia D.J., Rush L.J., Robertson G.P., Gao X., Wright F.A., Feramisco J.D., Peltomaki P., Lang J.C., Fruhwald M.C., Smiraglia D.J., Rush L.J., Robertson G.P., Gao X., Wright F.A., Feramisco J.D., Peltomaki P., Lang J.C., Smiraglia D.J., Rush L.J., Robertson G.P., Gao X., Wright F.A., Feramisco J.D., Peltomaki P., Lang J.C., Rush L.J., Robertson G.P., Gao X., Wright F.A., Feramisco J.D., Peltomaki P., Lang J.C., Robertson G.P., Gao X., Wright F.A., Feramisco J.D., Peltomaki P., Lang J.C., Gao X., Wright F.A., Feramisco J.D., Peltomaki P., Lang J.C., Wright F.A., Feramisco J.D., Peltomaki P., Lang J.C., Feramisco J.D., Peltomaki P., Lang J.C., Peltomaki P., Lang J.C., Lang J.C., et al. Aberrant CpG-island methylation has non-random and tumour-type-specific patterns. Nat. Genet. 2000;24:132–138. - PubMed
-
- Cross S.H., Charlton J.A., Nan X., Bird A.P., Charlton J.A., Nan X., Bird A.P., Nan X., Bird A.P., Bird A.P. Purification of CpG islands using a methylated DNA binding column. Nat. Genet. 1994;6:236–244. - PubMed
-
- DeRisi J., Penland L., Brown P.O., Bittner M.L., Meltzer P.S., Ray M., Chen Y., Su Y.A., Trent J.M., Penland L., Brown P.O., Bittner M.L., Meltzer P.S., Ray M., Chen Y., Su Y.A., Trent J.M., Brown P.O., Bittner M.L., Meltzer P.S., Ray M., Chen Y., Su Y.A., Trent J.M., Bittner M.L., Meltzer P.S., Ray M., Chen Y., Su Y.A., Trent J.M., Meltzer P.S., Ray M., Chen Y., Su Y.A., Trent J.M., Ray M., Chen Y., Su Y.A., Trent J.M., Chen Y., Su Y.A., Trent J.M., Su Y.A., Trent J.M., Trent J.M. Use of a cDNA microarray to analyse gene expression patterns in human cancer. Nat. Genet. 1996;14:457–460. - PubMed
-
- Estecio M.R., Youssef E.M., Rahal P., Fukuyama E.E., Gois-Filho J.F., Maniglia J.V., Goloni-Bertollo E.M., Issa J.P., Tajara E.H., Youssef E.M., Rahal P., Fukuyama E.E., Gois-Filho J.F., Maniglia J.V., Goloni-Bertollo E.M., Issa J.P., Tajara E.H., Rahal P., Fukuyama E.E., Gois-Filho J.F., Maniglia J.V., Goloni-Bertollo E.M., Issa J.P., Tajara E.H., Fukuyama E.E., Gois-Filho J.F., Maniglia J.V., Goloni-Bertollo E.M., Issa J.P., Tajara E.H., Gois-Filho J.F., Maniglia J.V., Goloni-Bertollo E.M., Issa J.P., Tajara E.H., Maniglia J.V., Goloni-Bertollo E.M., Issa J.P., Tajara E.H., Goloni-Bertollo E.M., Issa J.P., Tajara E.H., Issa J.P., Tajara E.H., Tajara E.H. LHX6 is a sensitive methylation marker in head and neck carcinomas. Oncogene. 2006;25:5018–5026. - PubMed
-
- Furuta J., Nobeyama Y., Umebayashi Y., Otsuka F., Kikuchi K., Ushijima T., Nobeyama Y., Umebayashi Y., Otsuka F., Kikuchi K., Ushijima T., Umebayashi Y., Otsuka F., Kikuchi K., Ushijima T., Otsuka F., Kikuchi K., Ushijima T., Kikuchi K., Ushijima T., Ushijima T. Silencing of Peroxiredoxin 2 and aberrant methylation of 33 CpG islands in putative promoter regions in human malignant melanomas. Cancer Res. 2006;66:6080–6086. - PubMed
Publication types
MeSH terms
Substances
Grants and funding
LinkOut - more resources
Full Text Sources
Other Literature Sources